
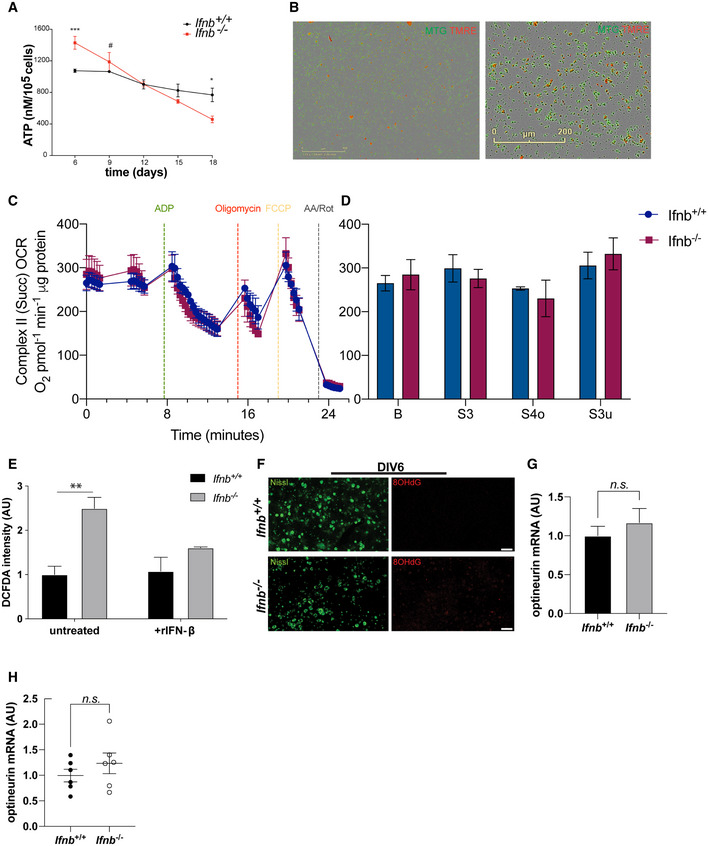
Figure EV2. Mitochondria are dysfunctional in Ifnb−/− neuron and brain, but this is not due to alterations of complex II function.
-
AQuantification of ATP on aging from 6 to 18 days in Ifnb +/+ and Ifnb –/– CNs. Error bars are mean + SEM from 3 independent experiments.
-
BMonolayer of mitochondria after isolation, labeled with MitoTracker Green and TMRE, showing intact and polarized mitochondria.
-
C, DRespiration of isolated mitochondria from Ifnb +/+ and Ifnb –/– whole brains. OCR measurements under Complex II substrate (succinate supplemented with rotenone to inhibit Complex 1 activity) were obtained at baseline (B) and on addition of ADP, oligomycin, FCCP, and rotenone/antimycin A to capture S3, S4o, S3u, and nonmitochondrial respiration. N = 3–4 mice per group. Bar graphs show mean + SEM.
-
EROS levels based on mean fluorescence intensity of DCFDA in DIV6 Ifnb +/+ and Ifnb –/– CNs.
-
FImmunofluorescence of 8OHdG in DIV6 CN cultures. Neurons were labeled with Nissl. Scale bars equal 50 μm.
-
GExpression of optineurin mRNA in DIV6 Ifnb +/+ and Ifnb –/– CNs, quantified by qPCR.
-
HExpression of optineurin mRNA in Ifnb +/+ and Ifnb –/– brainstems, quantified by qPCR.
Data information: For all graphs, error bars mean SEM; *P < 0.05, **P < 0.01, ***P < 0.001, and ****P < 0.0001 by t‐test (A; G; H) or two‐way ANOVA (E) with t‐test as post‐hoc.