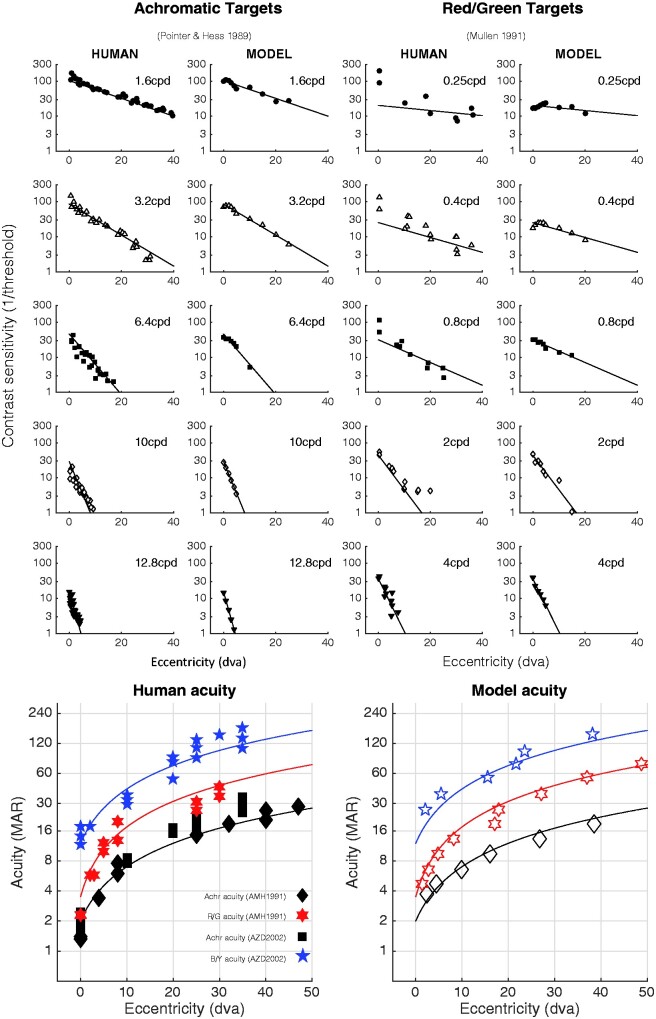
Figure 3.
The contrast sensitivity and acuity of the model are similar to that of human observers. The upper panels show human and model contrast sensitivity estimates for achromatic (left) and red/green (right) targets, for different target spatial frequencies (cycles per degree, cpd) and retinal eccentricities (in degrees of visual angle, dva). The straight lines are regression fits to the log-CS human data, and are the same in both data and model plots, to aid in by-eye comparison. The lower panels show acuity for achromatic, blue/yellow, and red/green grating stimuli; solid symbols are human acuity, open symbols are model acuity. The solid lines are linear fits to the human data, and are the same in both human and model panels.

