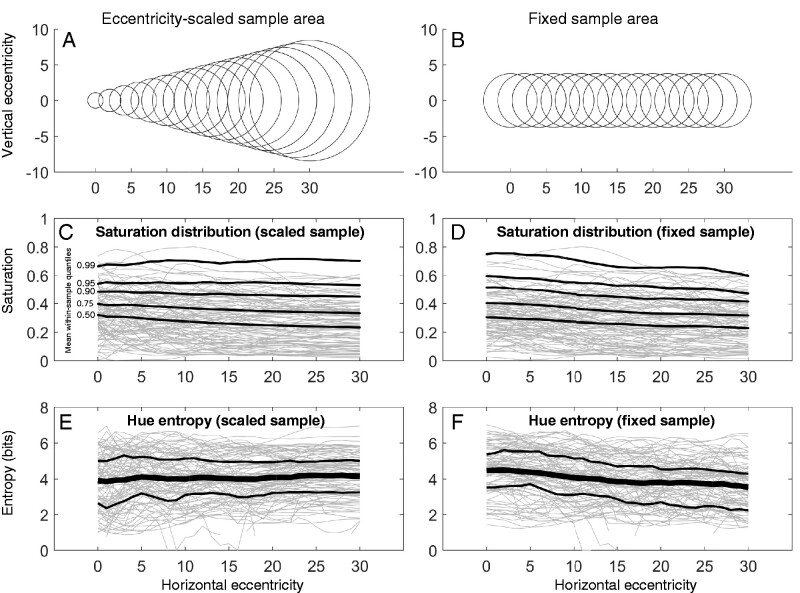
Figure 6.
Colourfulness statistics as a function of eccentricity, for eccentricity-scaled (A) and fixed (B) sample areas. (C, D) Saturation distributions. Each grey line is the mean HSV saturation, over eccentricity, for one image. The black lines trace the average upper quantiles (0.5, 0.75, 0.9, 0.95, and 0.99) over all images. (E, F) Hue entropy. Each grey line is the average hue entropy, over eccentricity, for one image. The black lines trace the average entropy over all images. The vertical bars are upper and lower entropy quartiles (0.25, 0.75) over all images.

