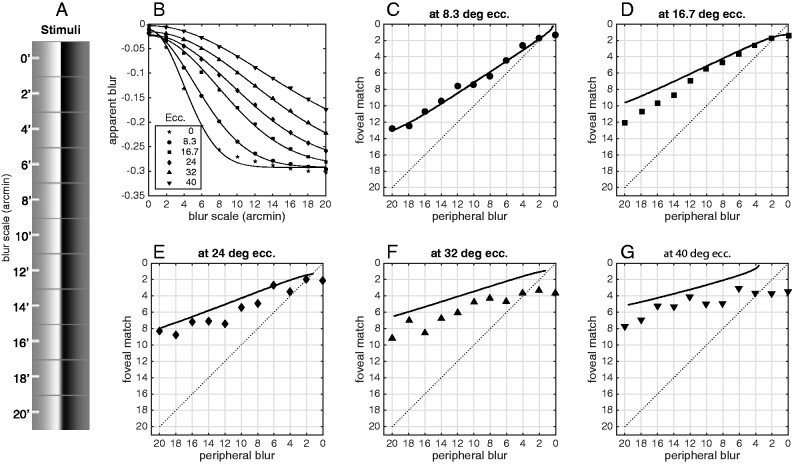
Figure 9.
(A) Stimuli used for the replication of Galvin et al (1997). Eleven levels of gaussian blur were applied to a monochrome vertical edge. The stimuli are illustrated to scale: the image is 10.67 degrees wide. (B) The ‘apparent blur’ statistic for a simple edge stimulus convolved with a gaussian with the scale constant on the x-axis (scale constant is in minutes of arc, i.e. 1°/60). The apparent blur metric is explained in the text. Each line is a Gaussian fit to the blur metric as a function of stimulus blur, for each of six stimulus eccentricities. (C-G) Apparent blur matched between a fixed-blur peripheral stimulus and an adjustable-blur foveal stimulus. Model matches between the foveal and peripheral blurs were computed numerically using the gaussian curves fitted in (B). Veridical matches would be on the main diagonal, and matches above the main diagonal mean that the peripheral stimulus appears sharper (less blurry) than it would if it were viewed foveally. Symbols are data from Galvin et al (1997)’s first experiment (replotted from their Figure 2). As eccentricity increases, the model becomes less accurate, over-estimating perceived sharpness of peripheral content. The model judges peripheral edges to be even sharper than the human observers judged them to be. Over the five test eccentricities {8.3, 16.7, 24, 32, ana 40} the average difference between model and data is small but consistently negative: {0.2, −1.0, −1.1, −2.0, and −1.9} arcmin, respectively.

