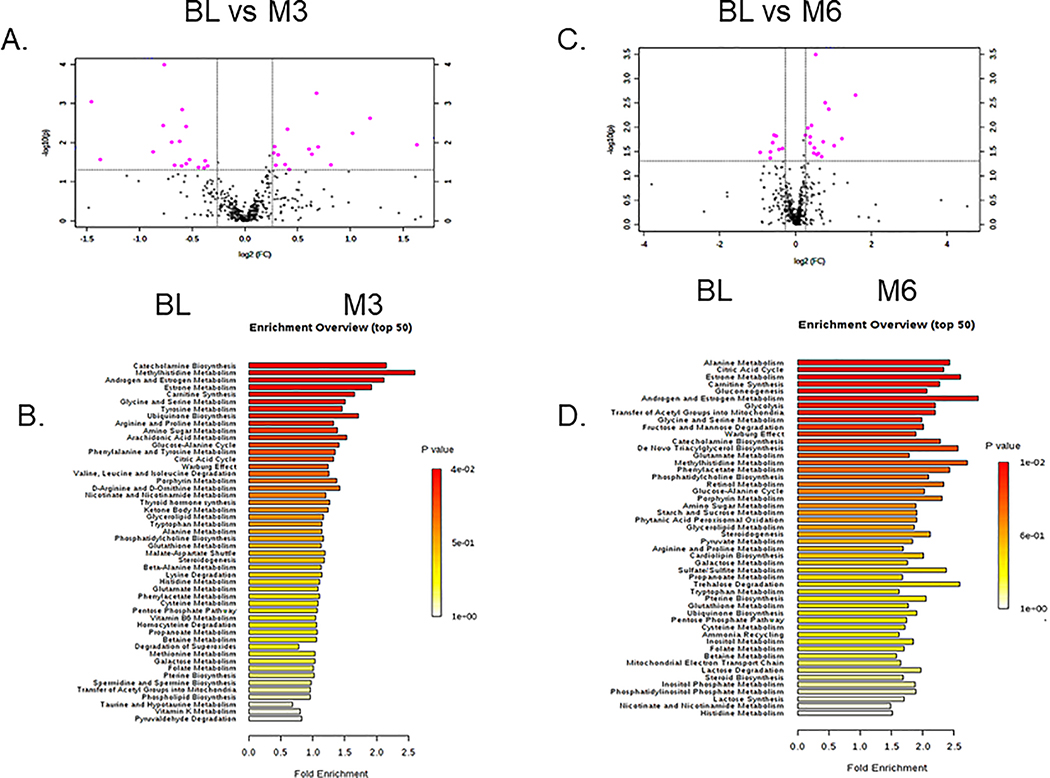
Figure 1: Top serum metabolites and metabolic pathways altered at 3- and 6-month after initiating ADT treatments in participants receiving LCD.
(A) Metabolites were selected by Volcano plot analysis of pairwise comparison between the BL vs. M3 (A) and BL vs. M6 (C) ADT. (B, D) Top enriched metabolic pathways affected by ADT after M3 (B) and M6 (D) of LCD.

