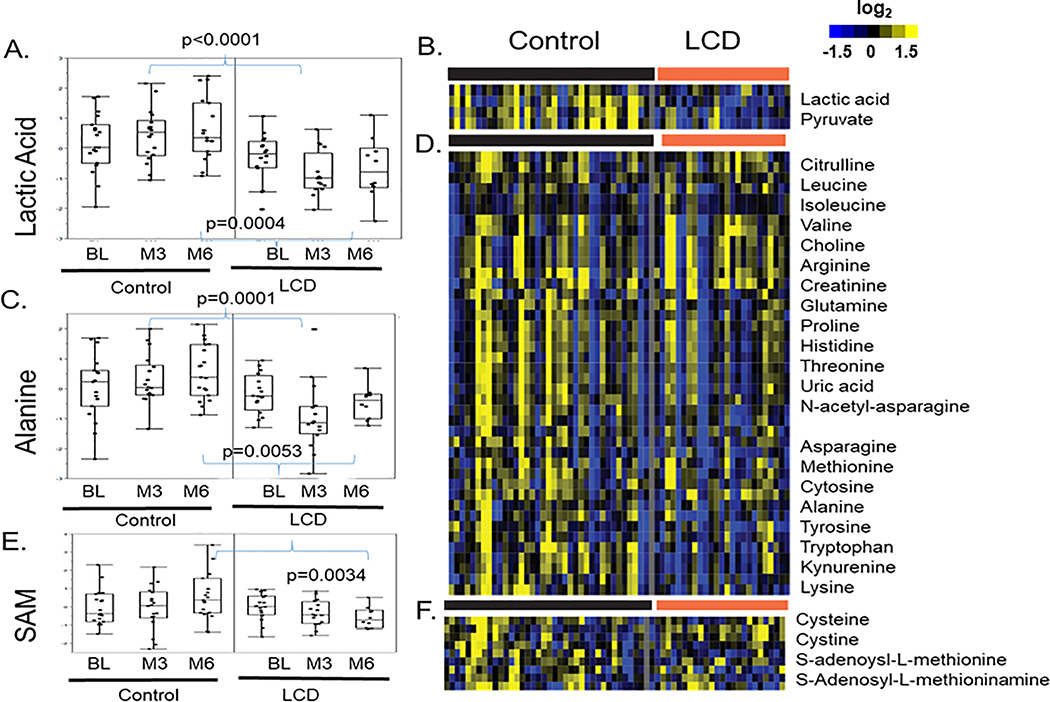
Figure 4: The effects of LCD on the ADT-altered lactic acid, alanine and S-adenosyl-L-methionine (SAM).
(A) The effects of ADT-induced changes in the lactic acid in the control and LCD arms at M3 and M6. (B) Heatmap of the clusters of metabolites that were altered in ways similar to lactic acid. (C) The effects of ADT-induced changes in the alanine in the control and LCD arms at M3 and M6. (D) Heatmap of the clusters of metabolites that were altered in ways similar to alanine. (E) The effects of ADT-induced changes in the S-adenosyl-L-methionine (SAM) in the control and LCD arms at M3 and M6. (F) Heatmap of the clusters of metabolites that were altered in ways similar to SAM. The statistical significance (p values) of ADT-induced changes of indicated metabolites is indicated.

