
Figure-2.
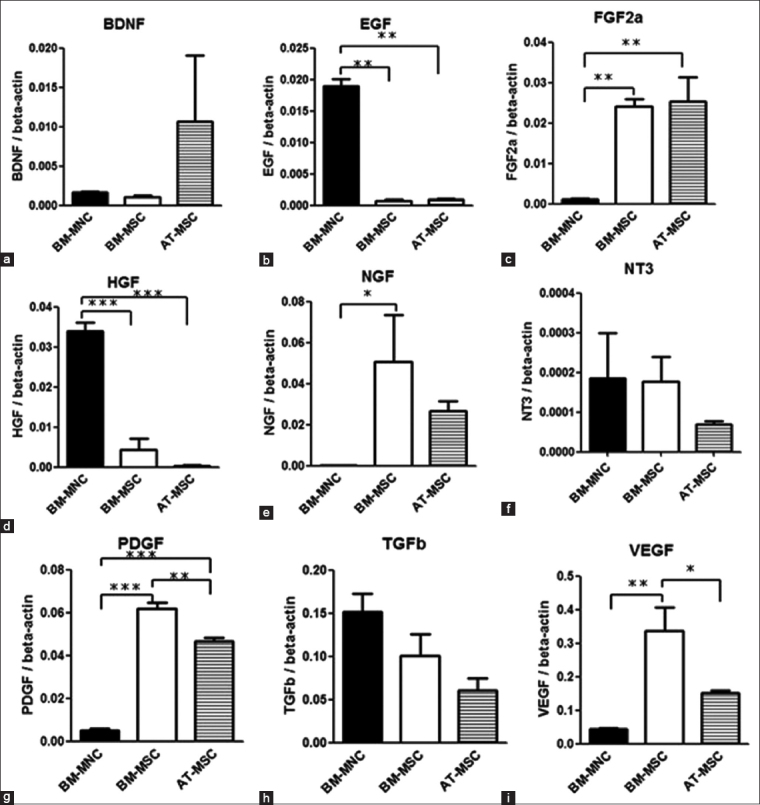
Quantitative real-time polymerase chain reaction. The levels of expression of dog growth factors mRNAs compared with those of bone marrow-derived mononuclear cells, adipose-derived-mesenchymal stem cells, and bone marrow-derived mesenchymal stem cells. Each value was normalized to beta-actin expression. Statistical comparisons were made with one-way analysis of variance (ANOVA) (*p<0.05) (**p<0.01) (***p<0.001). Means±SE, n=3.