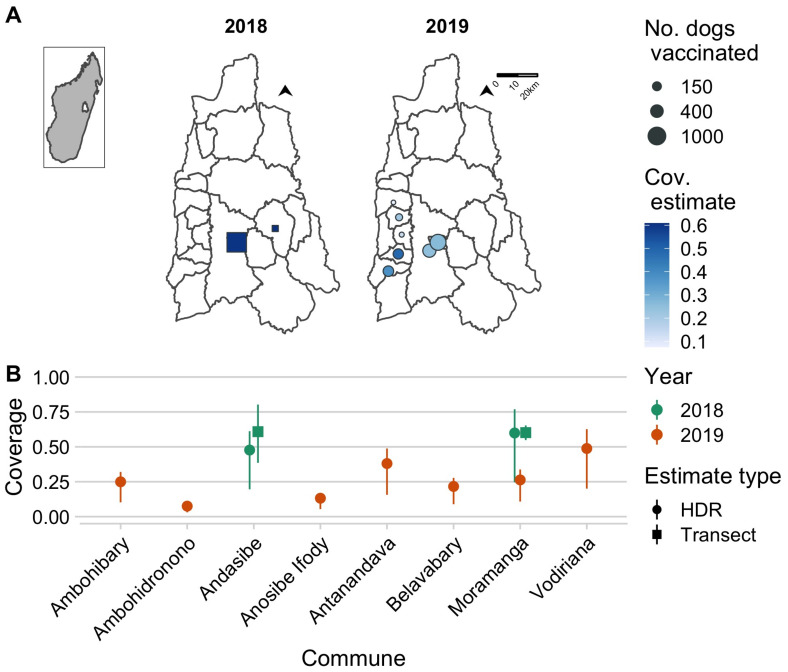
Figure 3.
Estimates of coverage achieved by the 2018 and 2019 campaigns. (A) The commune-level numbers of dogs vaccinated (size of points) and the associated coverage estimates (color of points) for the year 2018 (squares, estimated using post-vaccination transects) and 2019 (circles, estimated using a human-to-dog ratio (HDR) of 19.5, based on a recent household survey in the Moramanga District). The inset shows the location of the Moramanga District in Madagascar. (B) A comparison of coverage estimates by location and by method of estimation (shape of points correspond to post-vaccination transects vs. HDR-based estimates); for transect-based estimates, the line range shows the 95% exact binomial confidence interval, while for the HDR-based estimates, the line range shows the range of coverage estimates assuming an HDR range of 8–25 according to estimates from the literature.

