Figure 2.
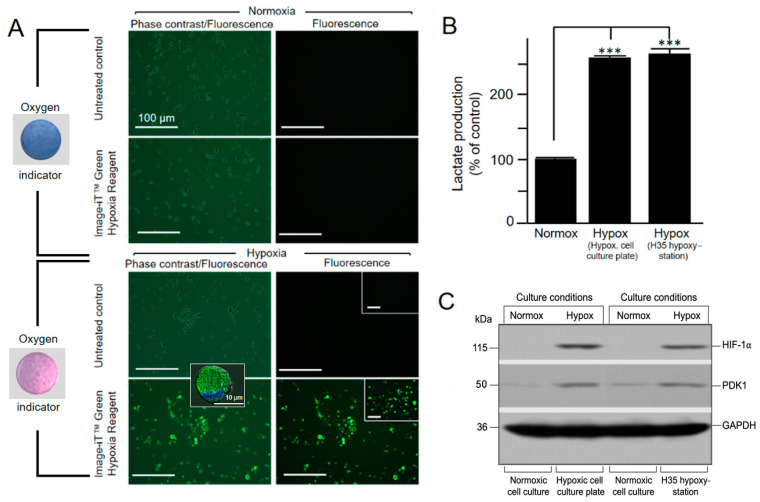
Cultivation of JAWS II cells under hypoxic cell culture conditions. (A) The microscopic images show the analysis of JAWS II cells after 5 h of cultivation under hypoxic cell culture conditions in a sealed hypoxic cell culture plate. Untreated and Image-iT Green Hypoxia-treated cells under norm- (top) and hypoxic (bottom) conditions are shown in phase contrast and under fluorescence (10× magnification). The corresponding color of the oxygen indicator is shown on the left. The lower left image insert shows a green fluorescent hypoxic cell taken with a Zeiss ApoTome fluorescence microscope using a 63× oil immersion objective (the cellular nucleus was costained with DAPI, blue). The inserts in the two lower right images show corresponding control and Image-iT Green Hypoxia-stained cells cultivated in a commercial hypoxystation. (B) JAWS II cells were cultured under norm-, and hypoxic conditions in either the hypoxic cell culture plate or a hypoxystation, as indicated, for 48 h after which cellular lactate was measured with an L-lactate assay kit (*** p < 0.001 versus controls; n = 3). (C) Immunoblot analysis of HIF-1α stability and PDK1 induction in JAWS II cells under norm- and hypoxic cell culture conditions after 72 h of cultivation in the hypoxic cell culture plate (second lane) and a commercial hypoxystation (fourth lane). GAPDH was included as a sample loading control.

