Figure 3.

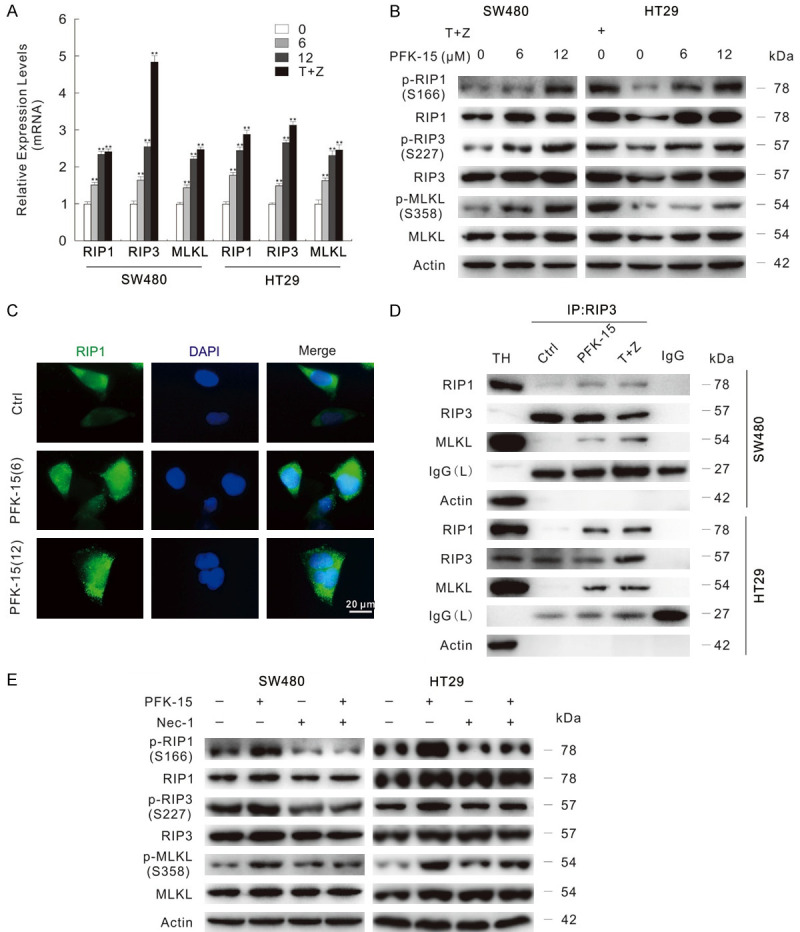
PFK-15 stimulates necroptosis in SW480 and HT29 cells. A. The mRNA expression of indicated genes were monitored by the real-time PCR following treatment with different dose of PFK-15 or T+Z for 6 h, **P < 0.01 vs. control. T+Z: hTNFα (10 ng/mL)+Z-VAD-FMK. B. Following PFK-15 treatment for 24 h, cells were lysed and then subjected to immunoblotting. C. RIP1 antibody was used in immunofluorescence staining in SW480 cells following exposure to indicated treatment for 6 h. Scale bars = 20 μm. D. SW480 cells were exposed to drugs for 24 h, cells lysates were precipitated using the RIP3 antibody. TH: The total homogenate; IgG: the negative control antibody. E. Immunoblotting was carried out following indicated treatment (Nec-1: 30 μM, unless otherwise indicated) for 24 h.
