Figure 7.

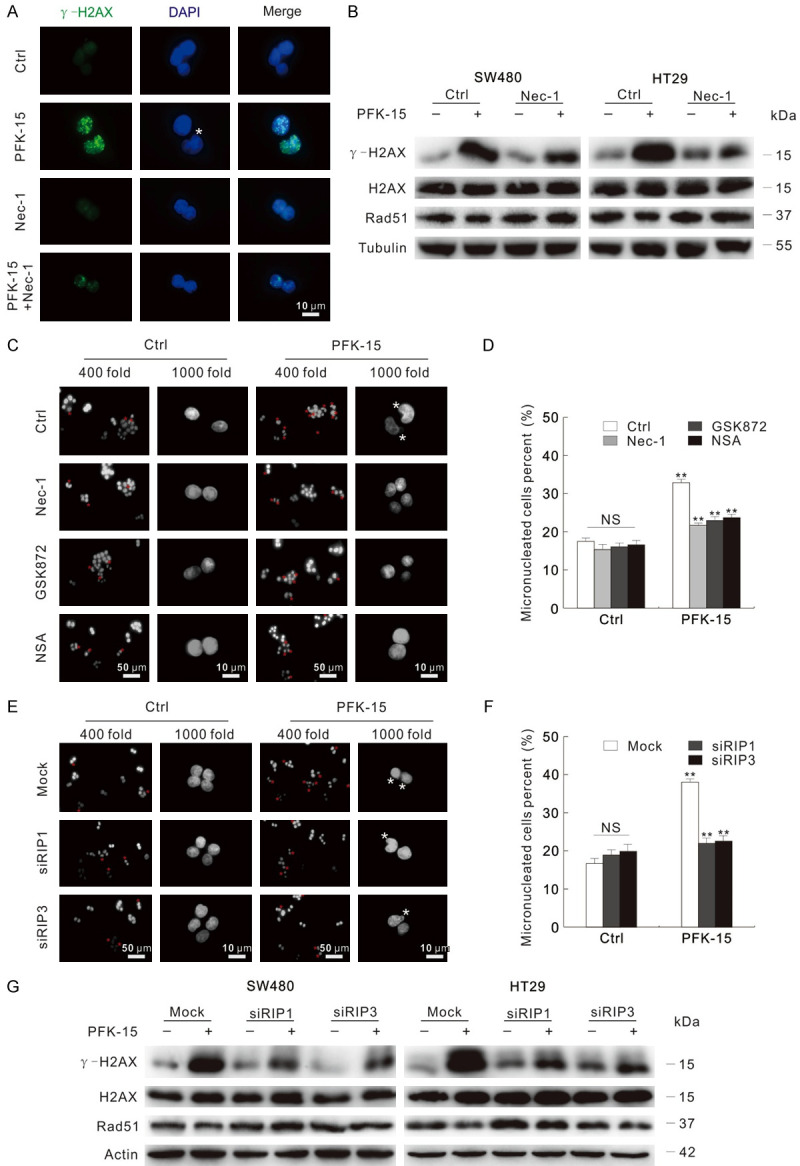
Inhibition of necroptosis depresses the genome instability induced by PFK-15. (A) Immunofluorescence using the antibodies of Tubulin and γ-H2AX were performed after exposed to indicated drugs for 6 h in SW480. (B) Following apporpriate treatment for 6 h, immunoblotting with indicated antibodies was carried out. (C and D) Following exposure to apporpriate drugs for 6 h, the images were captured by fluorescence microscopy after DAPI staining with both 400 and 1000 magnification. Micronuclei percentages were analyzed and shown as mean + S.D. in graphs (D), **P < 0.01. Each group included at least 50 cells, and sterisk indicated micronuclei. (E-G) Cells were transfected with the RIP1, RIP3 target siRNAs or control siRNA for 48 h. Following treatment with indicated chemicals for 6 h, fluorescence microscopy was used to acquire images after DAPI staining with both 400 and 1000 magnification (E); and the analyzed micronuclei percents were presented in (F); cell lysates were prepared and then monitored by immunoblotting after exposure to PFK-15 for 6 h (G). **P < 0.01 versus control, and NS indicated of none significant. The scale bars were shown in the figure. Asterisk indicated micronuclei.
