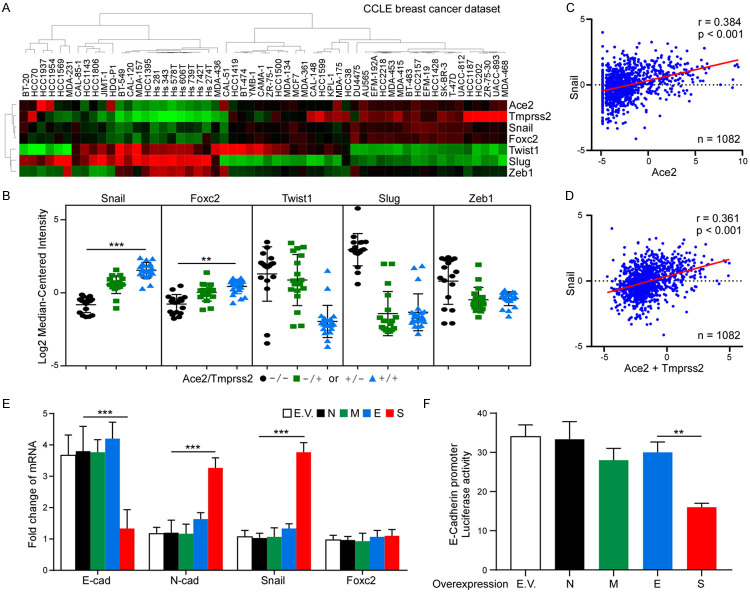
Figure 3.
Snail expression is correlated with ACE2 in breast cancer cells. A. Nonsupervised clustering of 56 breast cancer cell lines based on listed seven genes. Gene expression heatmap showing distinct expression patterns. Heatmap was generated using TreeView. B. Expression plots showing the average expression level of Snail, Foxc2, Twist1, Slug or Zeb1 in Ace2-/Tmprss2-, Ace2+/Tmprss2- and Ace2-/Tmprss2+, and Ace2+/Tmprss2+ subtypes. C. Correlation between Snail and Ace2 expression in TCGA breast cancer patient samples. D. Correlation between Snail and Ace2+Tmprss2 expression in TCGA breast cancer patient samples. E. qPCR analysis of E-cadherin, N-cadherin, Snail, and Foxc2 in MCF7 cells expressing N, M, E, or S. Two-way ANOVA with Tukey’s post hoc test. ***P < 0.001. F. Luciferase reporter assay of E-cadherin. MCF7 cells were transfected with the E-cadherin reporter together with SARS-CoV-2 structural protein N, M, E, or S. One-way ANOVA with Tukey’s post hoc test. **P < 0.01.

