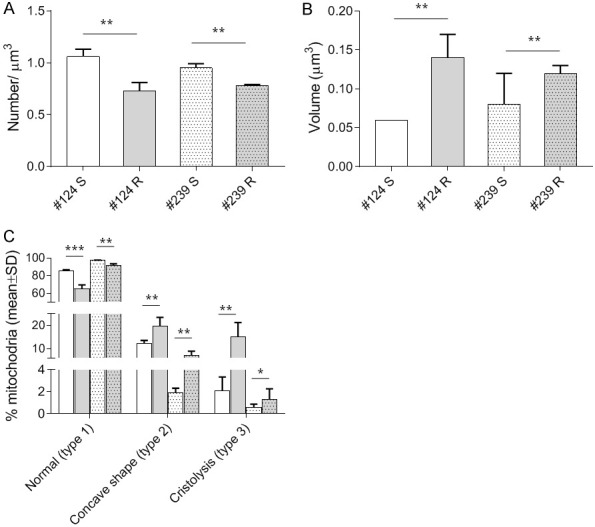
Figure 1.
Electron microscopy studies in #124 DDP-S (□) and -R (■), and #239 DDP-S (Mark 1) and -R (Mark 2). For each PDX histograms represent the number of mitochondria per µm3 (A), the mitochondrial volume (µm3, B), the percentage of normal mitochondria (Type I), % of Type II and Type III mitochondria (damaged), (C). Bars represents the mean ± SE of three different biological samples, done in triplicates. Statistical analysis was performed by t-test.