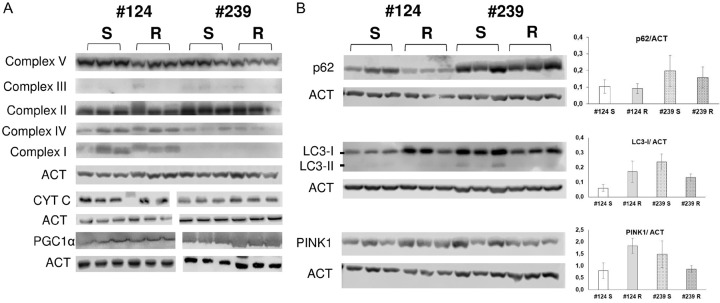
Figure 4.
Western blot analysis of oxidative phosphorylation system (OXPHOS), cytochrome c, PGC1α proteins (A), and autophagy and mitophagy related proteins p62, LC3-I and LC3-II, and PINK1 (B) in the different PDXs. The bars represent the mean ± SD of the ratio calculated for three biological replicates between densitometric signal of interest and control proteins.

