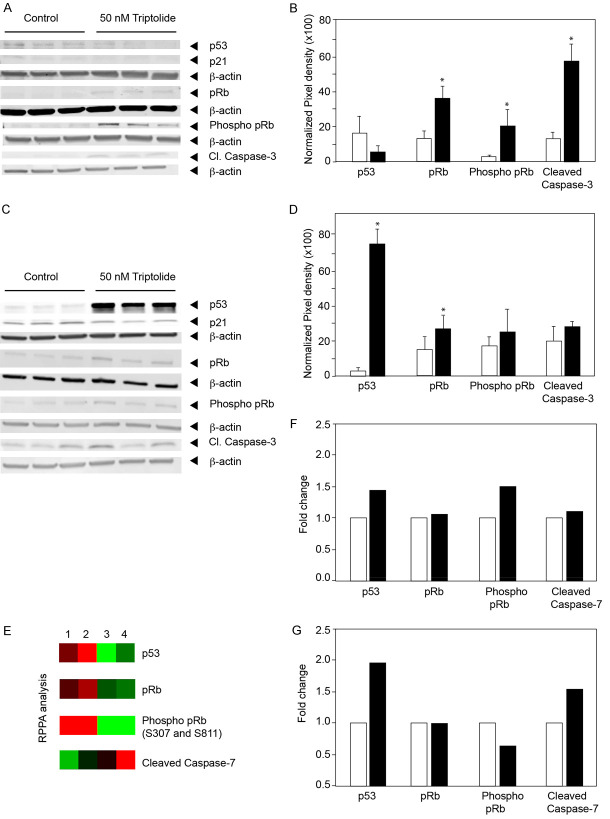
Figure 3.
Triptolide-induced changes in p53 and pRb proteins. (A and C) show protein levels of p53, p21, pRb, phosphorylated pRb, and Cleaved Caspase3 in control and Triptolide treated cells. Cell lysates were prepared following 48 hours of 50 nM of Triptolide treatment. (A) CaSki; (C) ME-180. (B and D) show the quantification of the changes from three independent Western blots following Triptolide treatment. (B) CaSki, (D) ME-180. Statistically significant differences are denoted by asterisks. (E) Reverse Phase Protein Array analysis (RPPA) of control and Triptolide treated cultures is shown as heatmap. Lanes 1 and 2 show cell lysates from CaSki cells and lanes 3 and 4 show cell lysates from ME-180 cells. Lanes 1 and 3 are control and lanes 2 and 4 are Triptolide treated samples. (F and G) show histogram of fold-changes in protein levels as determined by RPPA analyses. (F) CaSki and (G), ME-180 cells.

