Figure 2.
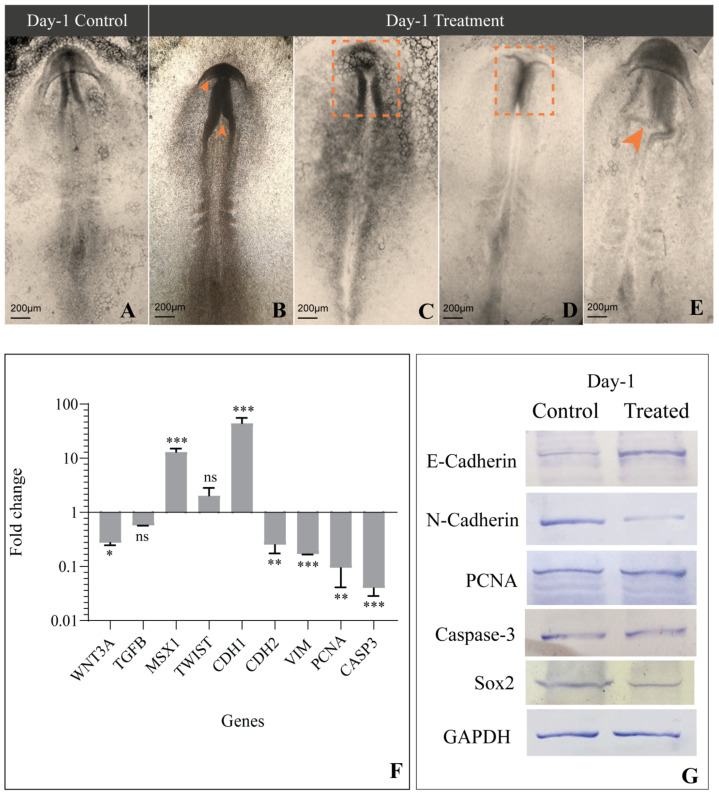
Morphological and molecular aberration due to COX-2 inhibition in the Day-1 embryo. (A) Control embryo with a well-developed neural tube, somite, and neural fold meet at the midbrain level; (B) Etoricoxib-treated embryos have a defective neural fold formation and meet at the forebrain level (orange arrowheads); (C) Etoricoxib-treated embryo showing delayed development and an abnormal neural fold formation (orange dotted square); (D) Fusion of neural folds impaired in the etoricoxib-treated embryo (orange dotted square); (E) Distorted neural fold marked by an orange arrowhead in the etoricoxib-treated embryo; (F) mRNA expression pattern of the genes involved in regulation of neural crest cell migration in etoricoxib-treated embryo. Values are expressed as fold change (mean ± SEM). Fold change values are compared with the control embryo for all genes (ns: non-significant, *: p ≤ 0.05, **: p ≤ 0.01, ***: p ≤ 0.001); (G) Western blot image showing the comparative expression of various proteins (E-cadherin, N-cadherin, PCNA, Caspase-3 and Sox2) on Day-1. GAPDH was taken as the loading control (n = 3 with 30 eggs per group).

