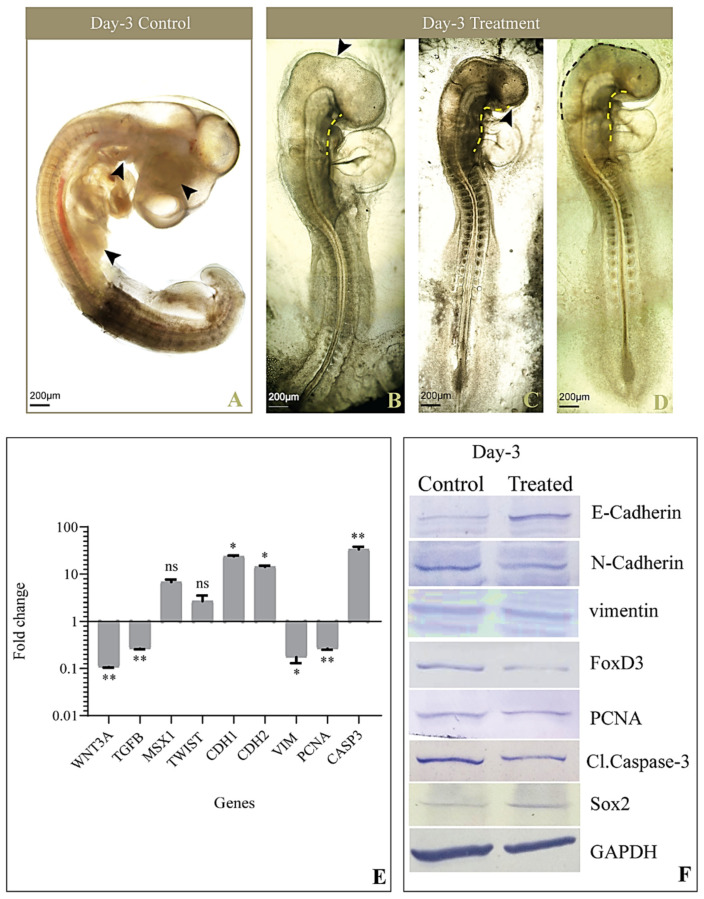
Figure 4.
Morphological and molecular observations of Day-3 embryo after treatment. (A) Control embryo showing a completely developed forebrain, midbrain and hindbrain, visceral clefts, limb buds, and a primitive eye (black arrowhead); (B) Treated embryo indicating poorly developed brain regions (black arrowheads), the absence of a visceral cleft (yellow dotted line), and limb buds; (C) Day-3 etoricoxib-treated embryo showing the absence of distinct brain regions, abnormal curving of the body, visceral clefts not formed (yellow dotted line), and the absence of a primitive eye (black arrowhead); (D) Etoricoxib-treated embryo showing an abnormal visceral cleft (yellow dotted line), and the head region is defectively formed (brown dotted line); (E) Transcript level of genes regulating head formation and neural crest cell migration in the etoricoxib-treated Day-3 embryo. Values are expressed as fold change (mean ± SEM). Fold change values of treated embryo are compared with respective controls for all the genes (ns: non-significant, *: p ≤ 0.05, **: p ≤ 0.01); (F) Western blot image showing the comparative expression of E-cadherin, N-cadherin, FoxD3, vimentin, PCNA, Caspase-3, and Sox2 on Day-3. GAPDH was taken as the loading control (n = 3 with 30 eggs per group).

