
Figure 5.
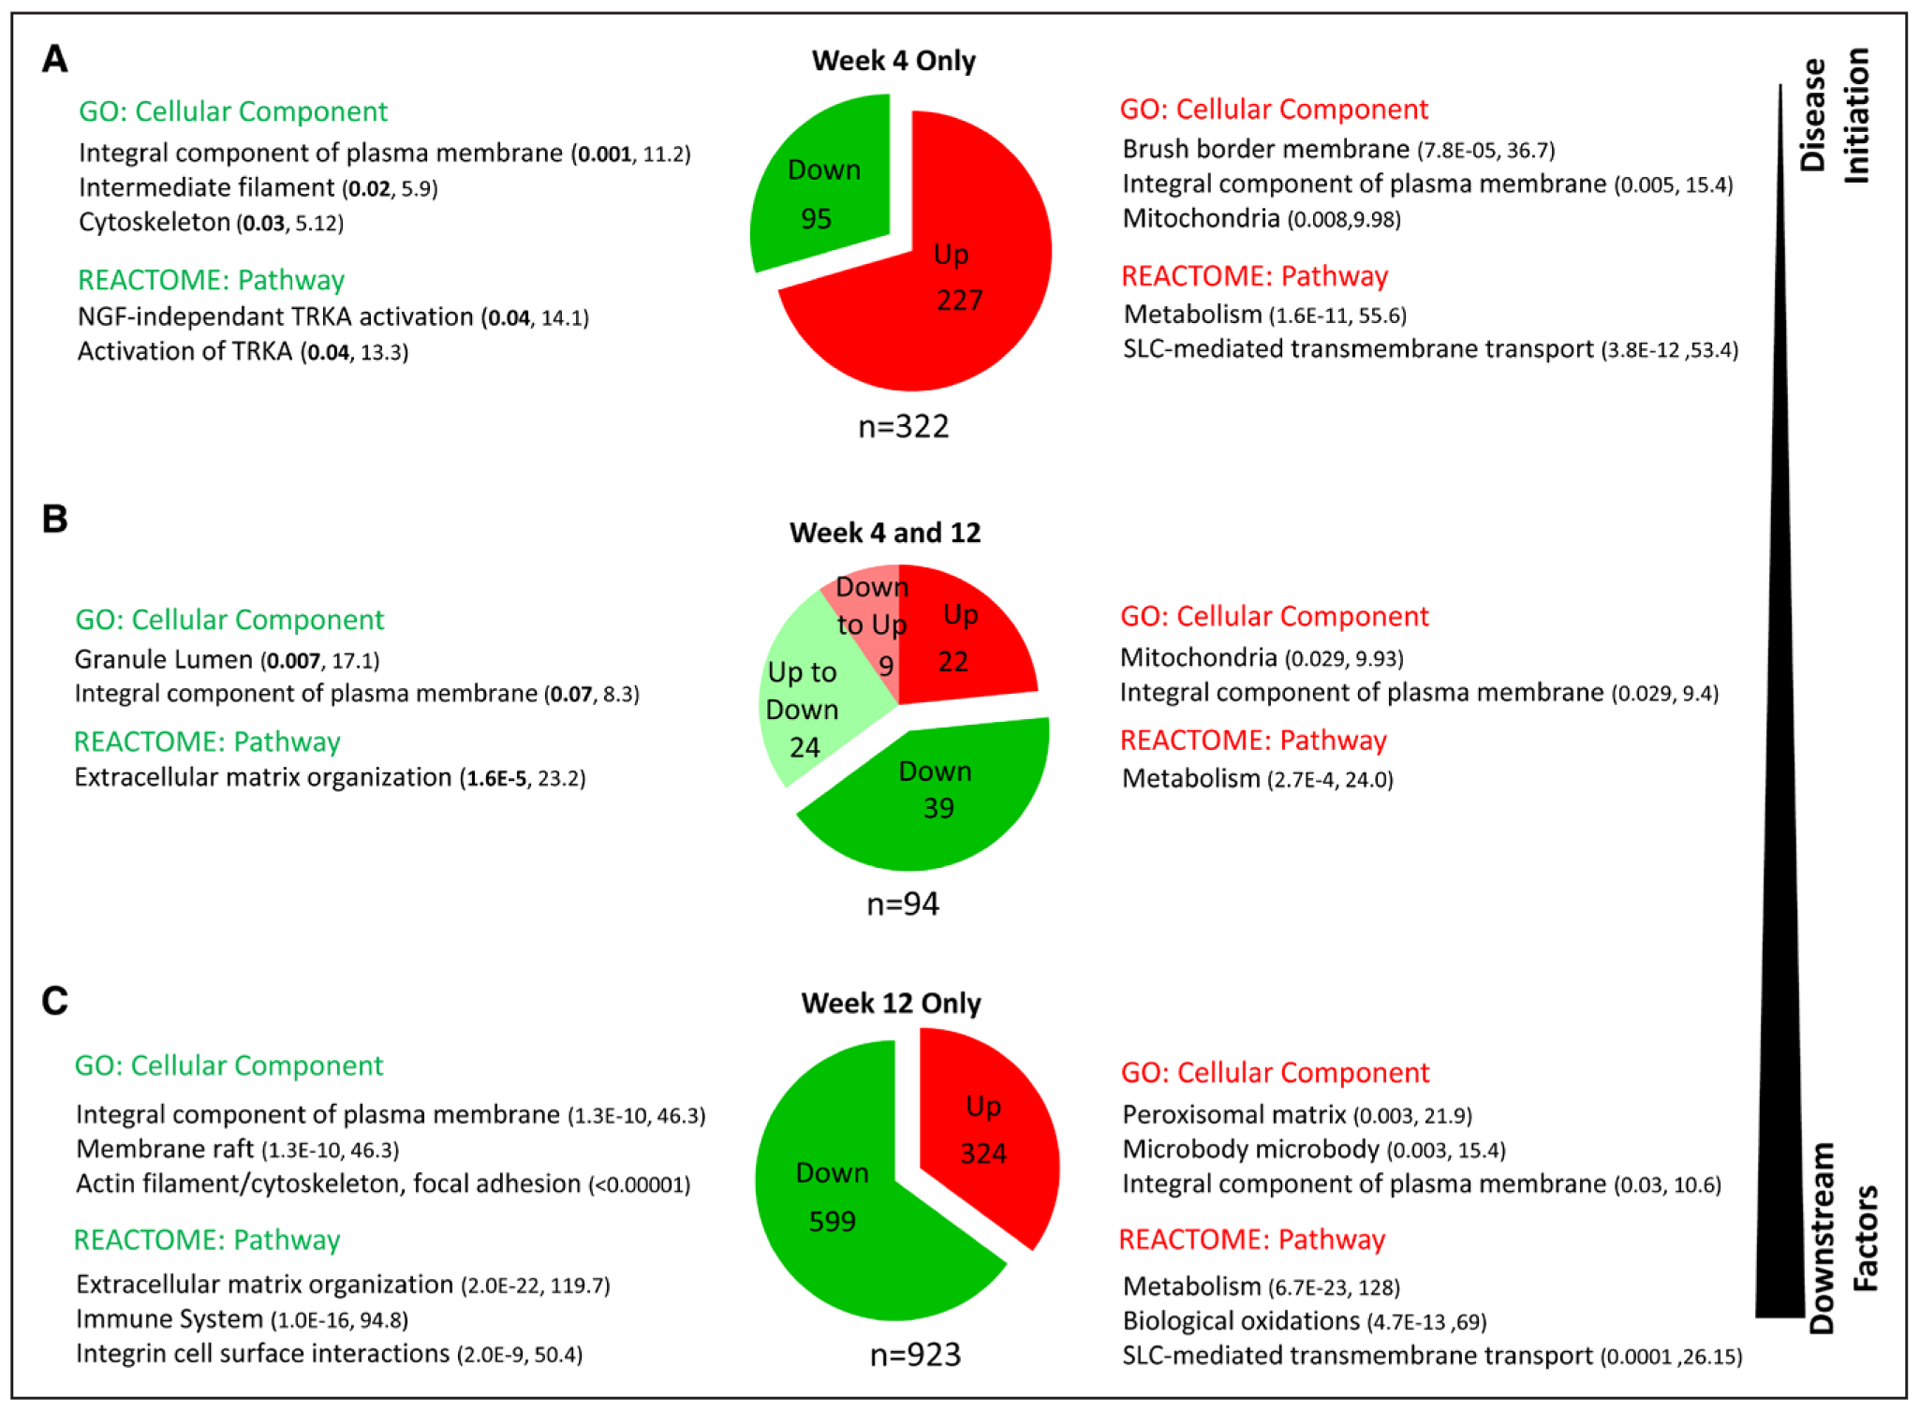
Pathway analysis of genes differentially expressed in kidney from wild-type Dahl salt-sensitive (SS-WT) and SS-Arhgef11−/− (KO) rats on low salt (0.3% NaCl) at week 4 and week 12. A, Top gene ontology (GO) terms and Reactome pathways of genes enriched at week 4 striated by upregulation/downregulation in KO vs WT. B, Top GO terms and Reactome pathways of genes enriched at both week 4 and 12. C, Top GO terms and Reactome pathways of genes enriched at week 12. For GO terms and Reactome pathways, the numbers within the parenthesis note the Q value (adjusted P value using the Benjamini-Hochberg method for correction for multiple hypotheses testing) and combined score (combination of the P value and z-score), both measures of significance for gene set enrichment. SLC indicates solute-carriers; and TRKA, Tropomyosin receptor kinase A.