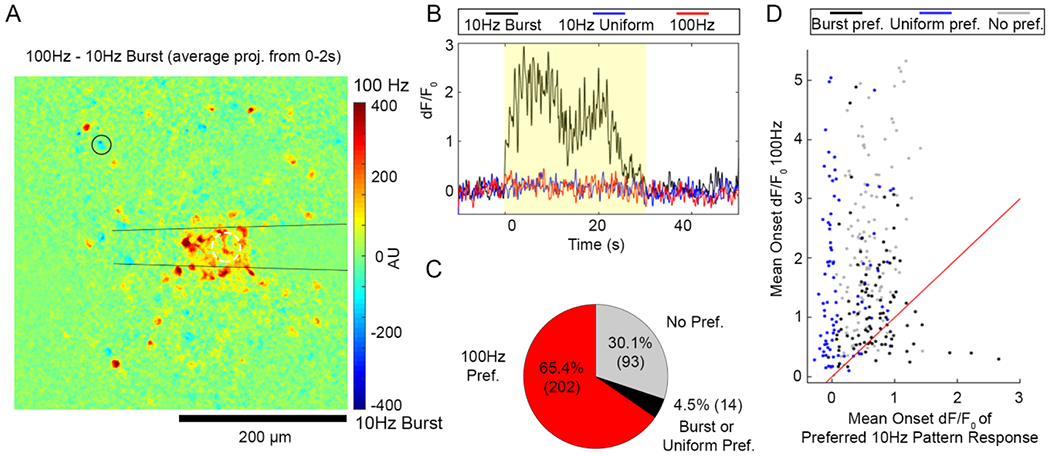
Figure 3.

Some neurons prefer 10 Hz-Burst or Uniform stimulation to the 100 Hz pattern despite 10X lower charge injection. (A) The difference of the cumulative fluorescence over 100 Hz and 10 Hz-Burst stimulations is projected such that cells that were more active during 100 Hz had positive values (warmer colors) and cells that were more active during 10 Hz-Burst had negative values (cooler colors). Some cells (example shown by the black circle) showed a slight preference for 10 Hz-Burst relative to 100 Hz. (B) A time trace of a cell that preferred 10 Hz-Burst over 10 Hz-Uniform and 100 Hz patterns (cell indicated by the black circle in panel (A)). (C) Cumulative counts of cells that preferred the 100 Hz Pattern (red), preferred either 10 Hz-Burst or Uniform over 100 Hz pattern, or had no preference show that it is rare for a cell to not prefer the 100 Hz pattern. (D) Scatter plot where each point represents the mean dF/F0 during the stimulation onset period (0–2 s) for the 100 Hz pattern (y-axis) and the highest mean onset dF/F0 between 10 Hz-Burst or Uniform. For this analysis, 309 cells were analyzed from n = 6 stimulation trials from a total of 5 animals.
