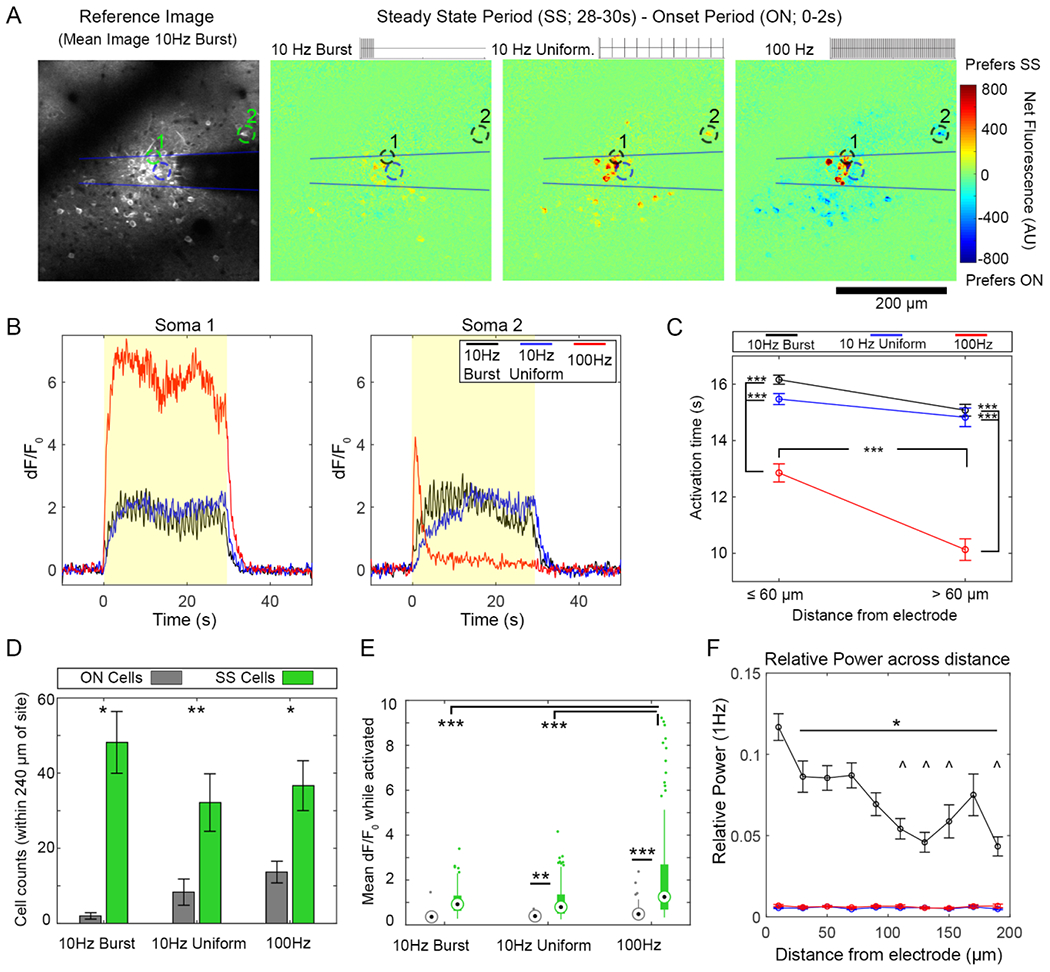
Figure 4.

Neurons have similar temporal responses to 10 Hz-Burst and continuous patterns while neurons tend to show more entrainment failure to the 100 Hz pattern. (A) The difference in dF/F0 between the onset period (ON, 0–2 s) and the Steady State period (SS, 28–30 s) indicates how well neurons can follow a 30 s train of each stimulation pattern. Increased activation during SS period compared to the ON period appears as a warmer color, while a decrease appeared as a cooler color. (B) While many somas can stay active for the full stimulation train (Soma 1), some fail to follow the train (Soma 2, 100 Hz) (C) Activation time captures the ability of a cell to stay active during a stimulation train. Neurons respond similarly to 10 Hz-Burst and Uniform patterns. In contrast with 100 Hz pattern, cells show a reduced activation time (fails to entrain at a more rapid rate). Two-way ANOVA indicated a statistically significant effect for both pattern and distance (p < 0.0001) with post-tests showing that both 10 Hz patterns had elevated activation time relative to 100 Hz at all distances (p < 0.0001). For the 100 Hz stimulation, activation time was significantly reduced >60 μm compared to ⩽60 μm (p < 0.0001). (D) There were more SS cells with all stimulation patterns (Two-way ANOVA significant effect for cell type ON v. SS: p < 0.0001) with * and ** indicating statistically significant post-hoc tests with p < 0.05 and p < 0.01, respectively. (E) For mean dF/F0, there were statistically significant effects between patterns and between ON v. SS cells (Two-way ANOVA, p < 0.0001). Post-hoc tests reveal that both 10 Hz patterns had similar mean dF/F0, while the 100 Hz waveform had elevated SS mean dF/F0 compared to the 10 Hz patterns. SS cells had a significantly elevated mean dF/F0 compared to the ON cells for the 10 Hz-Uniform and 100 Hz as well (** and *** indicate p < 0.01 and p < 0.0001, respectively). (E) Cells had significantly elevated relative 1 Hz power during 10 Hz-Burst stimulation compared to other patterns Two-way ANOVA analysis shows significant effects for stimulation pattern as well as distance (p < 0.00001), with elevated 1 Hz power for Burst stimulation compared to other groups at all distances (p < 0.05. Cells within 20 μm of the electrode had an elevated response to all other distances during Burst stimulation (p < < 0.05). Cells at distances indicated by ^ were significantly elevated compared to cells within 40–80 μm of the electrode. Data in (C), (D), and (E) presented as mean ± SEM; data in (D) presented in box plots. For this analysis, 309 cells were analyzed from n = 6 stimulation trials from a total of 5 animals (6 hemispheres).
