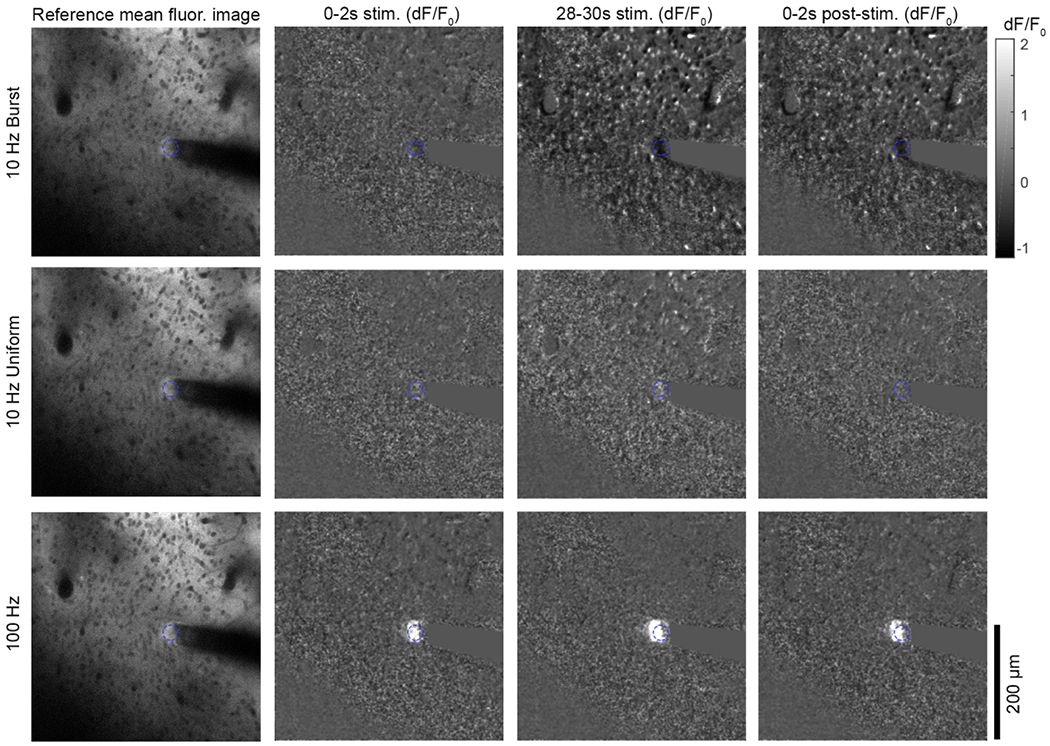
Figure 5.

Two-photon imaging glutamate release shows a pronounced response close to the electrode during the 100 Hz stimulation, but not for either 10 Hz pattern. The glutamate response to ICMS was measured using the iGluSnFr transgene expressed in neurons under control of the hSyn promotor. The mean fluorescence of the baseline period is presented on the left for all stimulation patterns, while the mean dF/F0 over the specified time periods is presented on the right for all stimulation patterns. The glutamate response is only detectable by eye for the 100 Hz group. In all images, the electrode site is indicated by the blue dashed circle. See supplemental movies 3–6.
