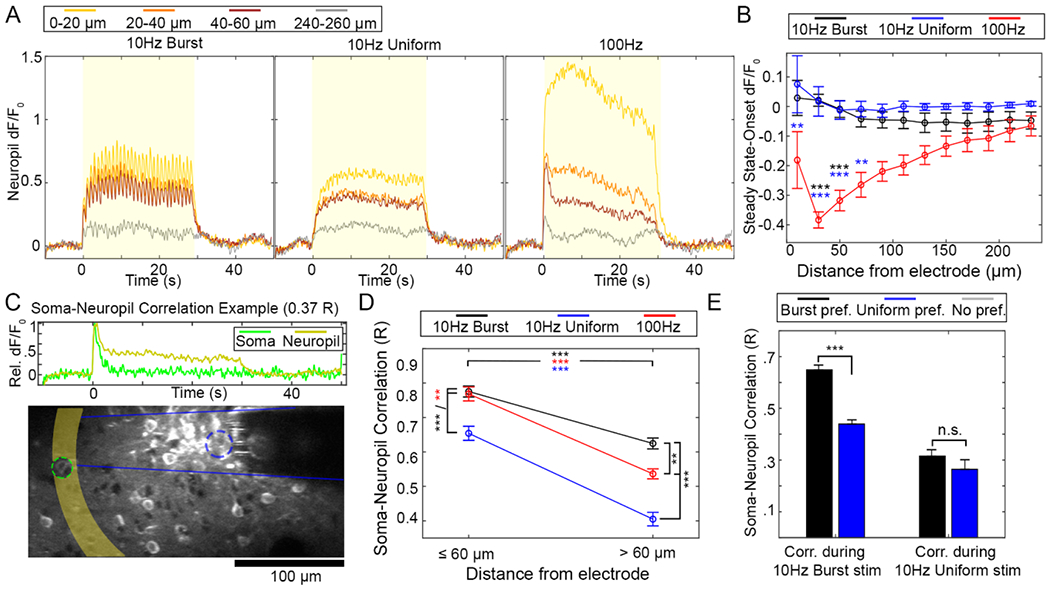
Figure 7.

Neuropil calcium activity is highly correlated to somatic calcium activity during 10 Hz-Burst and 100 Hz stimulation, but significantly less so for 10 Hz-Uniform stimulation. (A) Representative d F/F0 from the neuropil as a function of time for each stimulation pattern. Color represents different distances from the electrode array. The stimulation period is indicated by a yellow box. (B) Like the somatic response to 100 Hz pattern but not for either 10 Hz pattern, calcium activity faded between the Onset period and Steady State period. A two-way ANOVA indicates that there was a statistical difference between stimulation pattern, but not distance, with post-hoc tests indicating that the 100 Hz group experienced significantly more dF/F0 loss compared to the 10 Hz patterns as indicated by the black and blue *, with ** indicating p < 0.01 and *** indicating p < .0005. (C) The correlation between calcium in a soma and the neuropil within the same distance bin can be calculated. (D) The Soma-Neuropil Correlation was modulated by TP. Namely, 10 Hz-Burst and 100 Hz stimulation patterns had elevated soma-neuropil correlation proximate and distant to the electrode site relative to the 10 Hz-Uniform pattern. Two-way ANOVA showed a statistically significant effect for both pattern and distance (p < 0.0001), with post-hoc tests indicating that correlation was reduced for all groups at >60 μm compared to ⩽;60 μm. Further, somas and neuropil were more correlated with 10 Hz-Bursting and 100 Hz patterns than with 10 Hz-Uniform stimulation at all distances. ** and *** indicate p < 0.01 and p < 0.0001, respectively. (E) Soma-neuropil correlation during 10 Hz-Burst stimulation was significantly elevated for cells that preferred 10 Hz-Burst stimulation compared to cells that preferred 10 Hz-Uniform stimulation (two-way ANOVA and post-hoc tests: p < 0.001). However, correlation during 10 Hz-Uniform stimulation as similar between cells of both preferences. All data presented as mean ± SEM. For this analysis, 309 cells were analyzed from n = 6 stimulation trials from a total of 5 animals.
