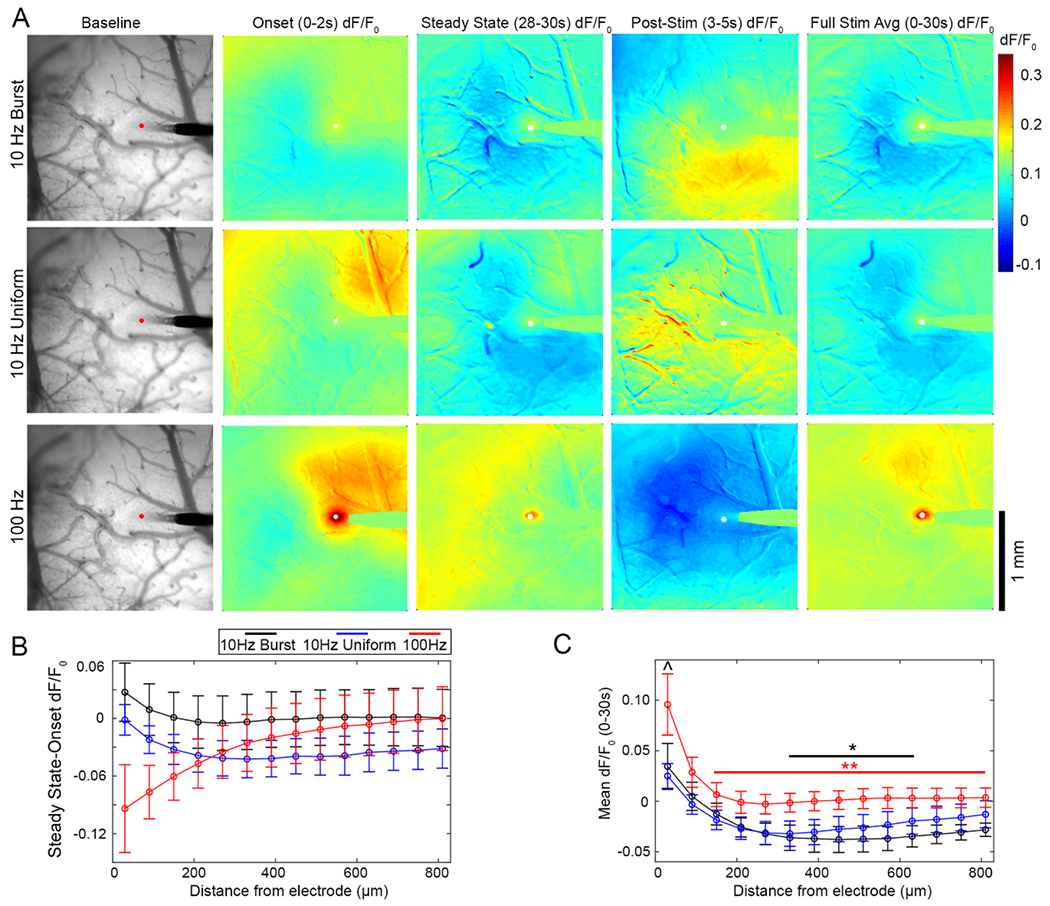
Figure 8.

Mesoscale imaging of neuronal calcium response to ICMS shows distant inhibition during both 10 Hz patterns. (A) Representative images of the neuronal calcium response to 10 Hz-Burst and Uniform stimulation patterns. Images are shown as an average of fluorescence intensity over the baseline period, the dF/F0 from 0–2 s of stimulation, 28–30 s of stimulation, and 3–5 s post-stimulation, and the mean dF/F0 over the entire 30 s stimulation train. See supplemental movies 7–9 for activation over time. (B) Similar to the two-photon neuropil imaging, there is loss of activity over the 30 s stimulation train proximal to the electrode for 100 Hz stimulation. Interestingly, there in regions beyond the 2P imaging window (>250 μm), there was also loss of activity for over the stimulation train for both 10 Hz groups (significant two-way ANOVA effect for TP: p < 0.001). (C) Further, mean dF/F0 over the stimulation train (0–30 s) as a function of distance from the electrode shows distant inhibition for both 10 Hz stimulation patterns., but not the 100 Hz pattern. Two-way ANOVA confirms that there is a statistically significant difference between the patterns and over distance (p < 0.0001), with [I^ indicating a significant difference between the 10 Hz-Burst pattern and 100 Hz patterns within 0–60 μm of the electrode (p < 0.05). Additionally, * and ** indicate significant differences between the 0–60 μm bin and indicated bins (p < 0.05, p < 0.001, respectively. Color indicates the pattern of comparison). Data is presented as mean ± SEM, with n = 4 stimulation trials from a total of 3 different animals.
