
Fig. 1.
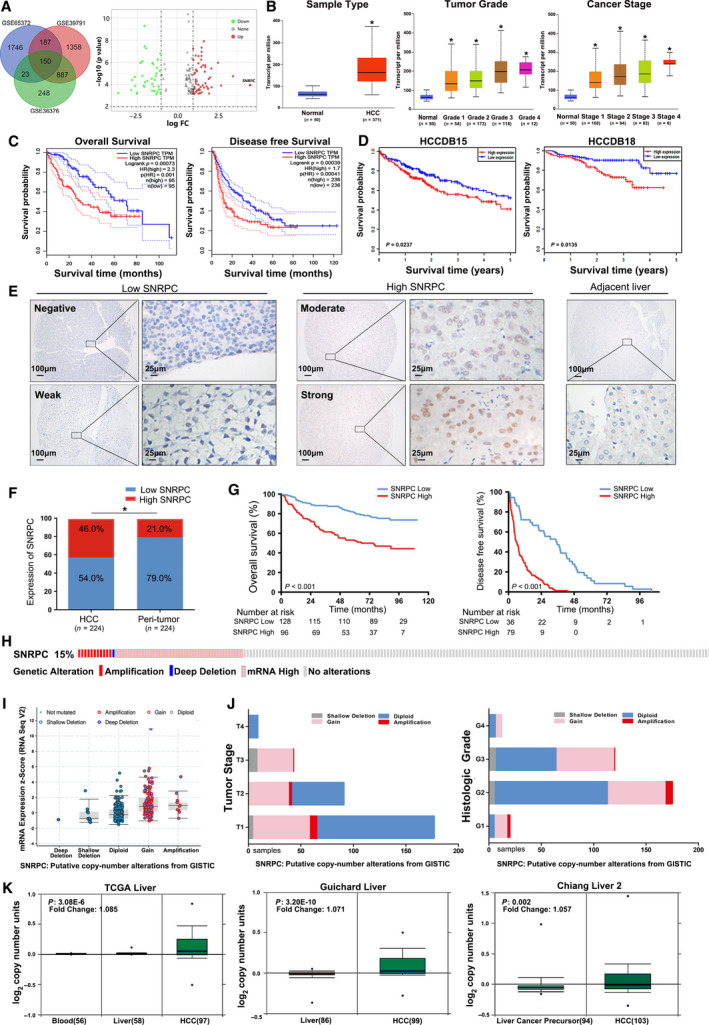
SNRPC correlates with poor prognosis in patients with HCC and presents with a higher CNV in HCC tissues compared with normal control tissues. (A) Venn diagram. DEGs were selected among the mRNA expression profiling sets GSE65372, GSE39791 and GSE36376. SNRPC transcription in the subgroups of patients with HCC stratified by (B) sample type, tumor grade and cancer stage, analyzed by UALCAN (from the TCGA database). Data are mean ± standard error. *P < 0.05. OS and DFS of SNRPC in (C) GEPIA and (D) HCCDB databases. (E) The images of different levels of SNRPC expression in HCC (left) and adjacent noncancerous liver tissues (right) detected by immunohistochemical staining (IHC). Scale bars: 100 or 25 μm. (F) SNRPC expression in HCC and peritumor tissues according to IHC scores: low SNRPC (0–5) and high SNRPC (6–12). *P < 0.05, based on the Wilcoxon matched pairs test. (G) Kaplan–Meier survival analysis of OS and DFS for patients with high and low SNRPC expression. (H) OncoPrint of SNRPC alterations in LIHC (cBioPortal). The different types of genetic alterations are highlighted in different colors. (I) SNRPC expression in different SNRPC CNV groups. SNRPC gain group has a significantly higher expression level. (J) Distribution of SNRPC CNV frequency in different tumor stage and histological grade subgroups. (K) SNRPC copy number in TCGA Liver, Guichard Liver and Chiang Liver 2 datasets, respectively.