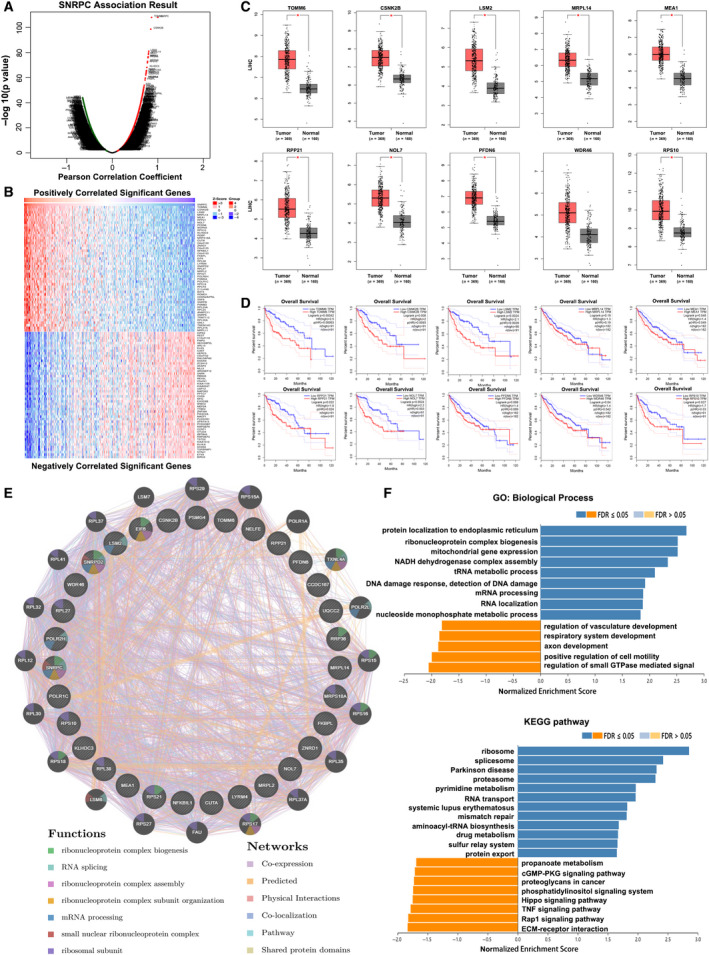
Fig. 2.

Coexpression genes and PPI analysis of SNRPC in HCC. (A) SNRPC coexpression genes in HCC (LinkedOmics). (B) Heatmaps showing the top 50 genes positively and negatively correlated with SNRPC in HCC. Red indicates positively correlated genes, and green indicates negatively correlated genes. (C) The top 10 most correlated with SNRPC genes were highly expressed in tumor tissues, analyzed by GEPIA. (D) OS of the top 10 most correlated with SNRPC genes from GEPIA. (E) PPI network and functional analysis of the top 30 genes correlated with SNRPC (GeneMANIA). Different colors of the network edge indicate the bioinformatics methods applied. The different colors for the network nodes indicate the biological functions of the set of enrichment genes. (F) The function module of LinkedOmics performs analysis of GO biological processes (BPs) and KEGG pathways among SNRPC coexpression genes in the LIHC cohort.
