
FIGURE 6.
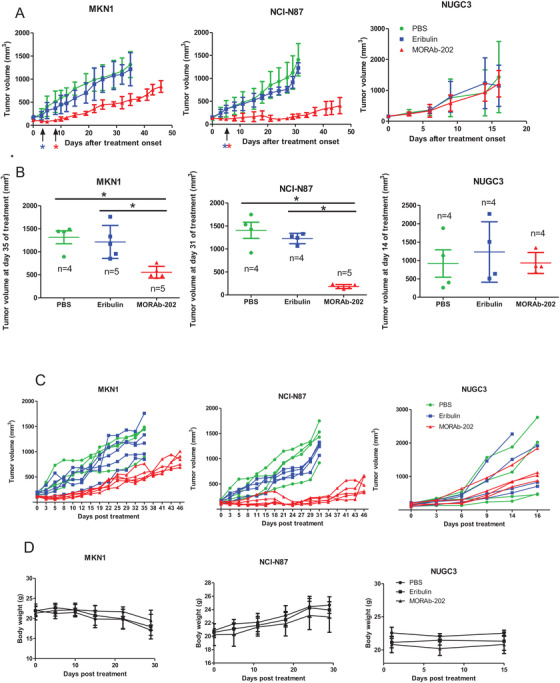
The effect of MORAb‐202 on the xenograft with high FOLRα expression and those with FOLRα low expression. A, Tumor volume for nude mice bearing subcutaneous tumors formed by MKN1, NCI‐N87, or NUGC3 cells and treated intraperitoneally with MORAb‐202 (5 mg/kg), the equivalent molar dose of eribulin (0.1 mg/kg), or PBS vehicle (100 μl) on day 0. Data are means ± SEM. Red and blue asterisks indicate P < .05 for comparisons between MORAb‐202 and eribulin and between MORAb‐202 and PBS at the indicated times, respectively (one‐way ANOVA followed by Tukey's post hoc test). B, Tumor volume determined as in (A) for MKN1 cells at day 35, NCI‐N87 cells at day 31, and NUGC3 cells at day 14. Individual values and the mean ± SEM are shown. *P < .05. C, Tumor volume for each mouse treated with MORAb‐202, eribulin, or PBS in Figure 6A. D, The body weight of mice treated with MORAb‐202, eribulin, or PBS in Figure 6A. Data in D are means ± SEM