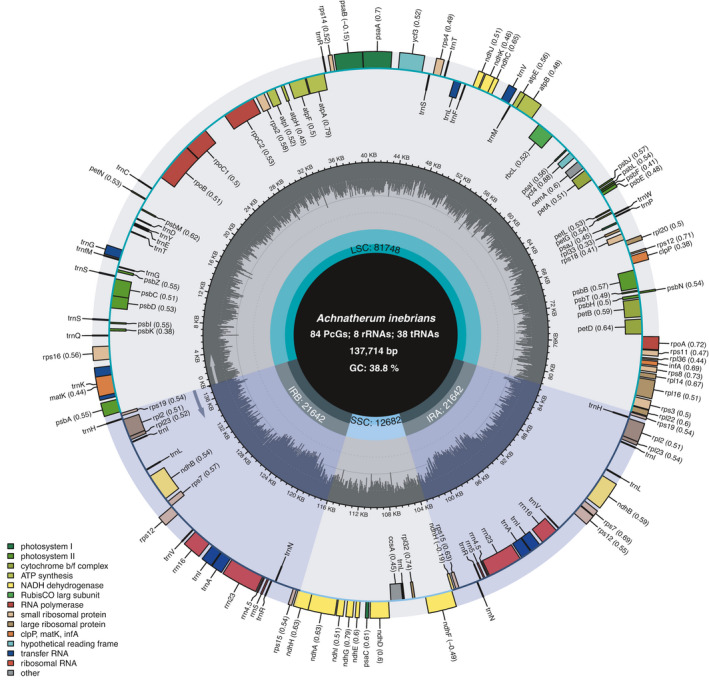
Fig. 1.

Chloroplast genome map of Achnatherum inebrians. The center of the figure provides the specific information (length, GC content and number of genes) of the A. inebrians chloroplast genome. In the first inner circle, the proportion of the shaded parts represents the GC content of each part. The lengths of the corresponding small single‐copy (SSC), IR (IRa and IRb) and LSC regions are also listed. The gene names and their optional codon usage bias are labeled on the outermost layer. The transcription directions for the inner and outer genes are listed clockwise and anticlockwise, respectively.
