Fig. 3.

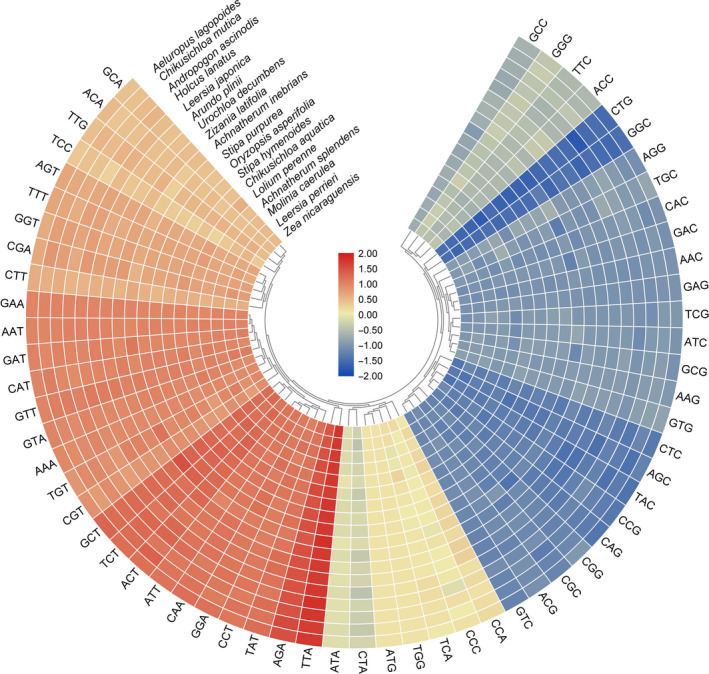
Heatmap analysis for codon distribution of all protein‐coding genes of 18 Poaceae species. Color key: higher red values indicate higher RSCU values, and lower blue values indicate lower RSCU values.

Heatmap analysis for codon distribution of all protein‐coding genes of 18 Poaceae species. Color key: higher red values indicate higher RSCU values, and lower blue values indicate lower RSCU values.