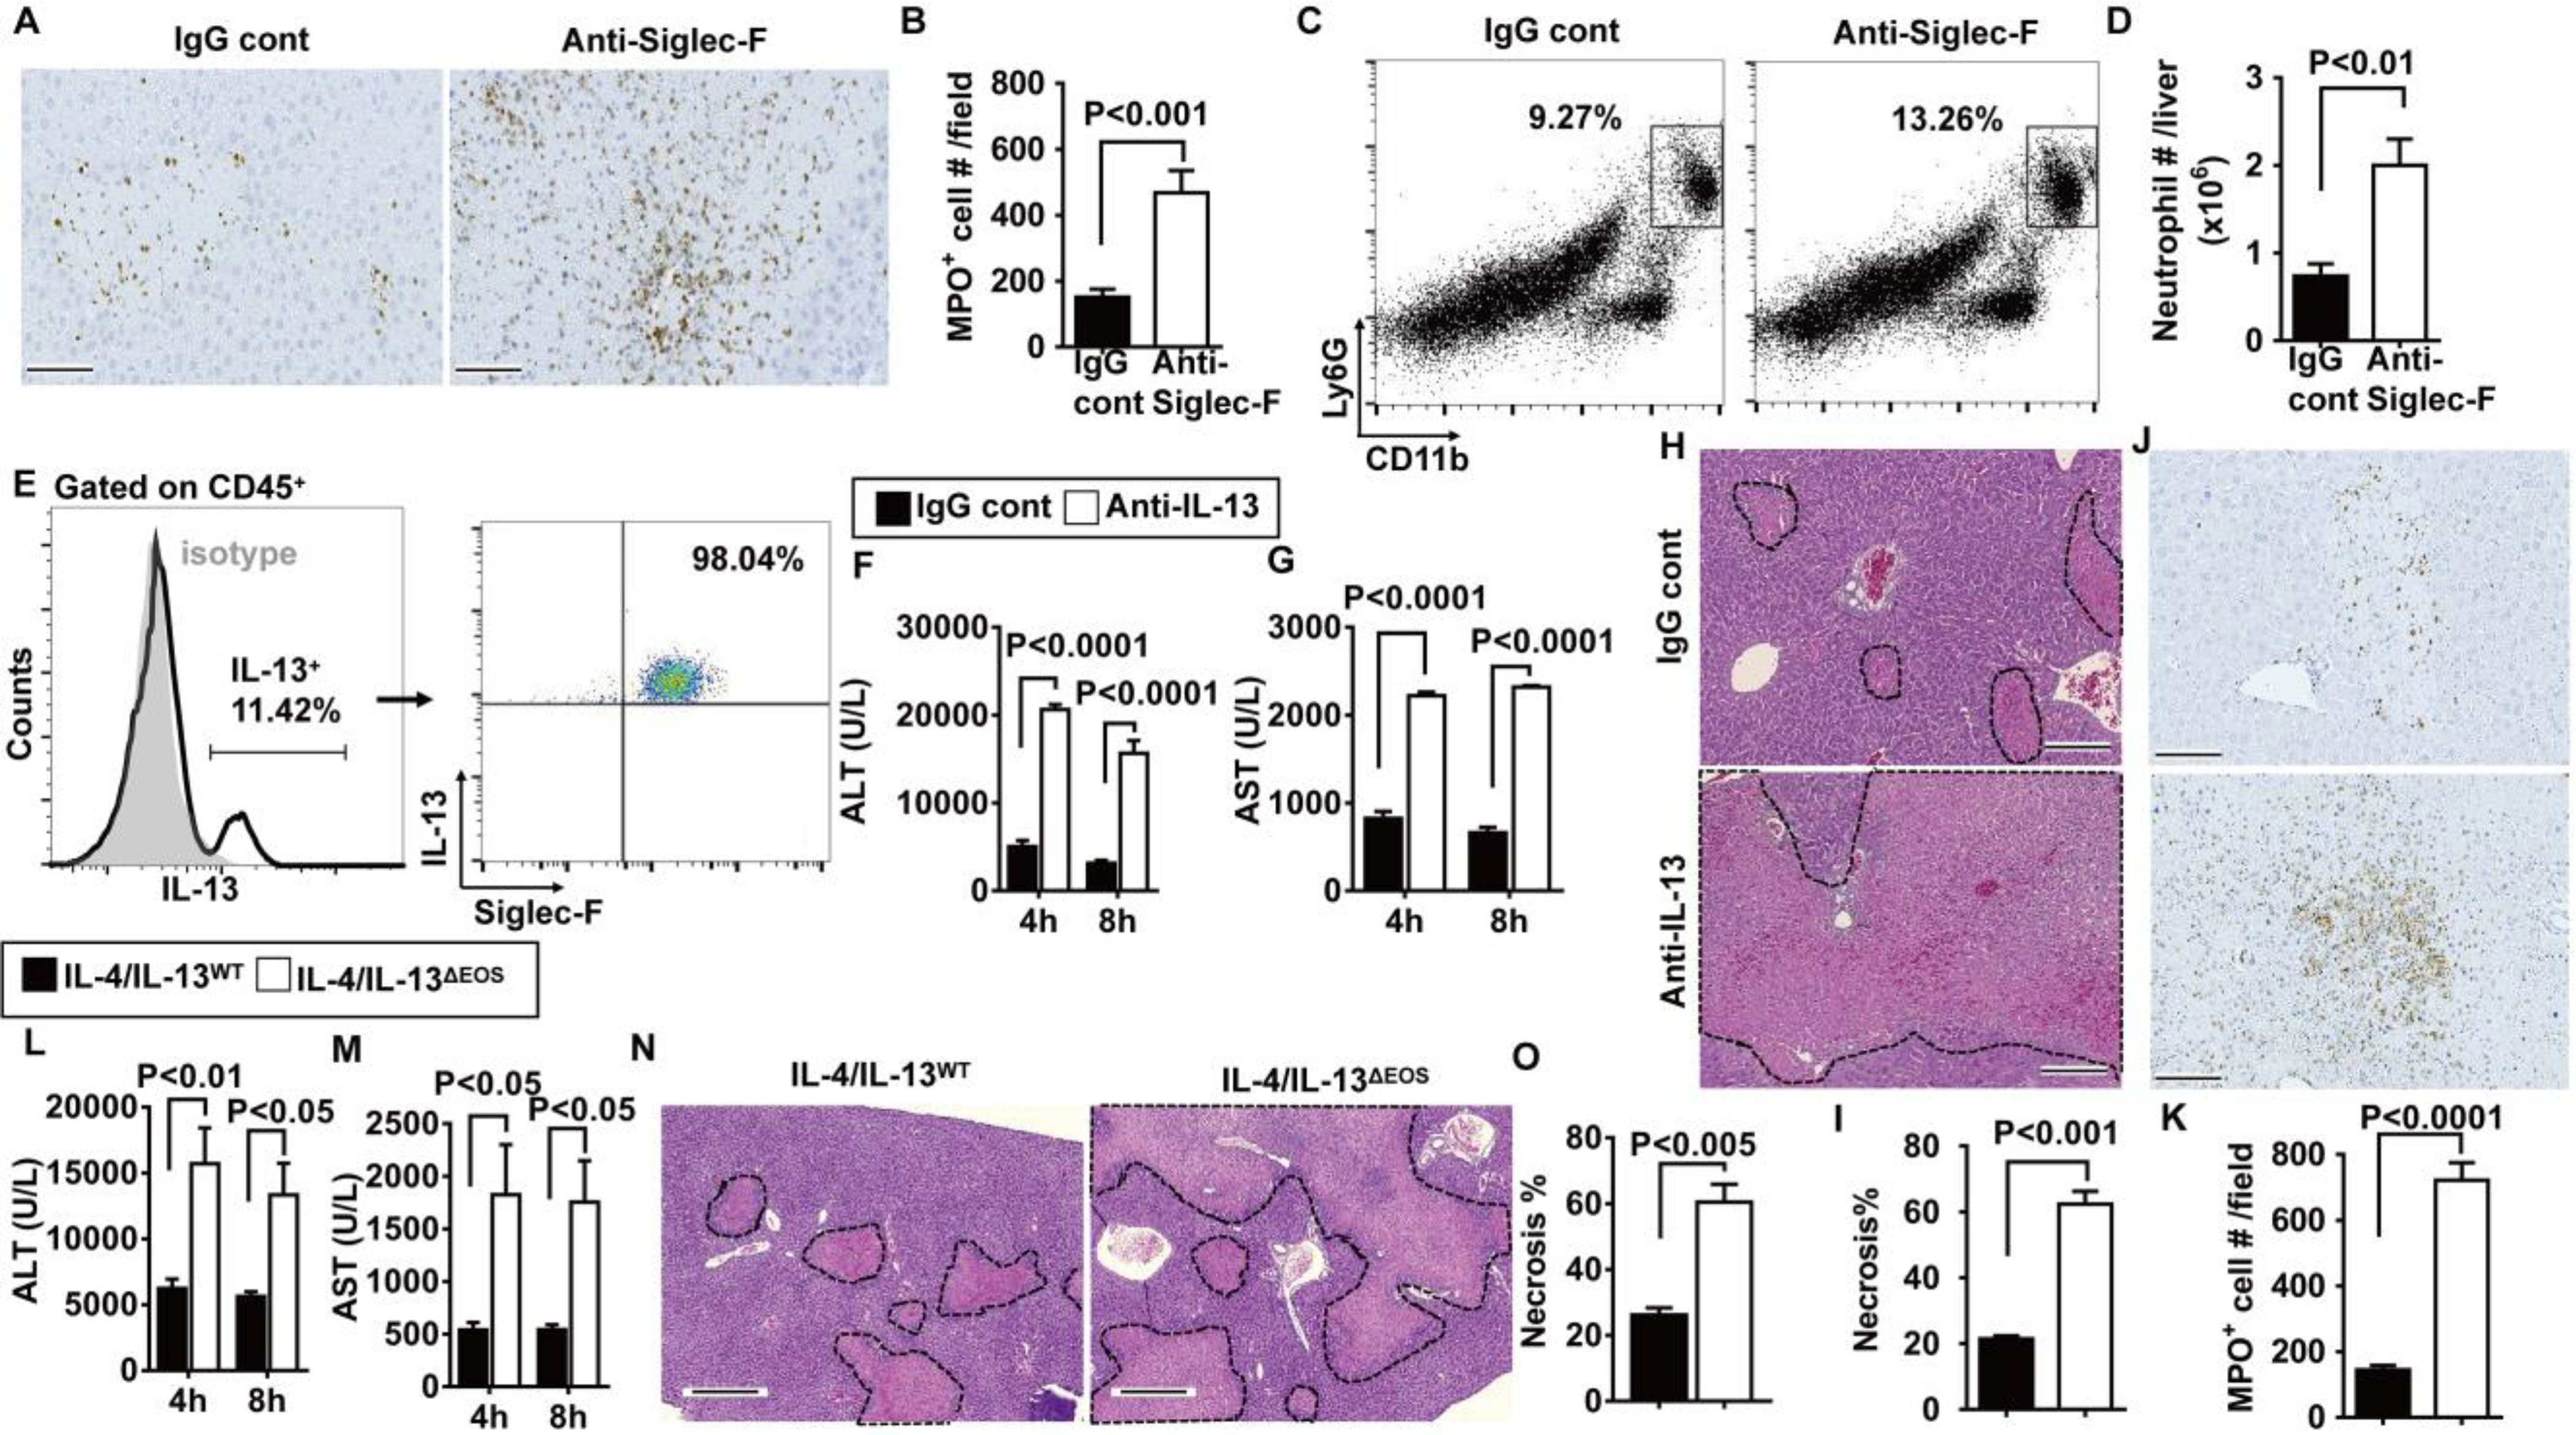
Fig. 5. Eosinophils suppress neutrophils through IL-13 production.

(A) Eosinophils were depleted by anti–Siglec-F antibody in male C57BL/6 mice at 24 hours before hepatic IR surgery, and neutrophils were stained for MPO (brown; scale bars, 200 μm) and (B) quantified in the liver (n = 3 mice per group). (C) Representative flow cytometry plots and (D) quantification of Ly6G+CD11b+ cells at 24 hours after reperfusion are shown (n = 4 mice per group). (E) Liver nonparenchymal cells were isolated from WT mice at 4 hours after reperfusion and stained for intracellular IL-13. IL-13–positive cells were gated, and the proportions of eosinophils (Siglec-F+) that express IL-13 among total IL-13+ cells are shown (n = 4 mice per group). (F to K) WT mice were injected with anti–IL-13–neutralizing antibody or IgG control 1 hour before IR surgery (n = 3 mice per group). Serum concentrations of ALT (F) and AST (G) were measured at 4 and 8 hours after reperfusion. Liver necrosis (scale bars, 200 μm) was evaluated (H) and quantified (I). Neutrophil accumulation was examined at 24 hours after reperfusion by myeloperoxidase (MPO) staining (brown; scale bars, 200 μm) (J) and quantified (K). (L to N) IL-4/IL-13ΔEOS mice and IL-4/IL-13WT littermates were subjected to IR surgery (n = 3 mice per group). Serum concentrations of ALT (L) and AST (M) were measured at 4 and 8 hours after reperfusion. Liver necrosis (scale bars, 200 μm) was examined (N) and quantified (O) at 24 hours after reperfusion. A two-tailed unpaired Student’s t test with Welch’s correction was performed in (B), (D), (I), (K), and (O). A two-way ANOVA was performed in (F), (G), (L), and (M).
