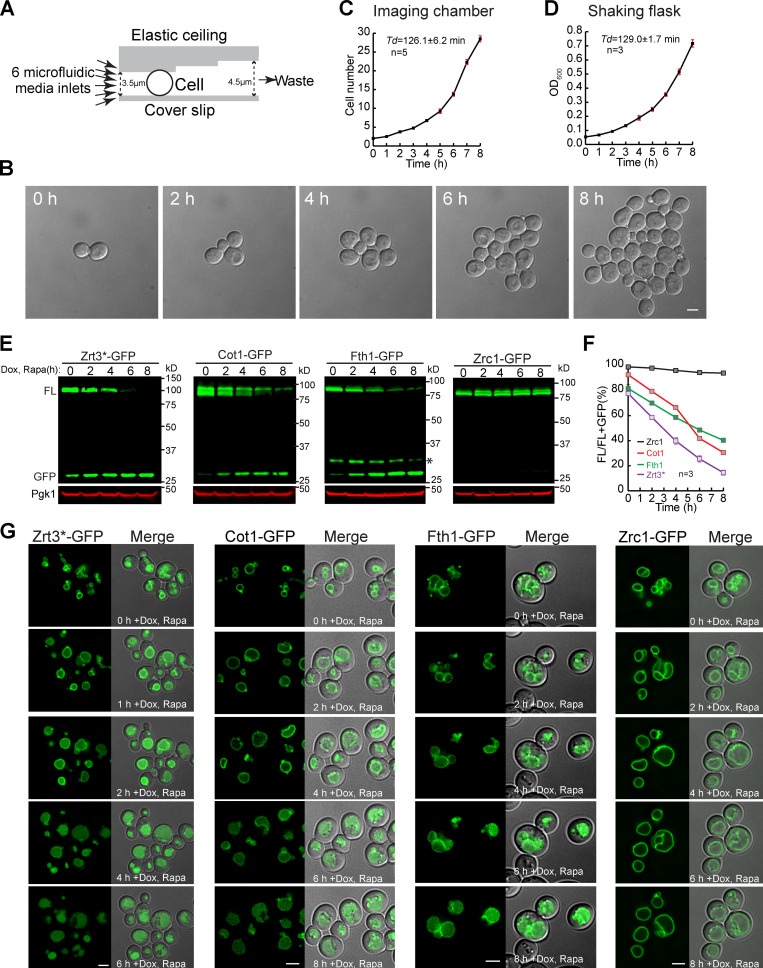
Figure 1.
Developing a live-cell imaging method to study VM dynamics.(A) Design of a microfluidic imaging chamber. (B) Time-lapse imaging of mid-log cells in a microfluidic imaging chamber. (C and D) Growth curves showing the Td of WT cells in an imaging chamber (C) or shaking flask (D). Error bars represent SD. (E) Western blots to measure the degradation kinetics of VM proteins. Asterisk indicates the protease cleavage product. (F) Quantification (±SD, n = 3) of protein levels in E. (G) Time-lapse imaging to capture the degradation of VM proteins. Scale bars, 2 µm. Dox, doxycycline; FL, full-length protein fused with GFP; Rapa, rapamycin.

