Figure S2.
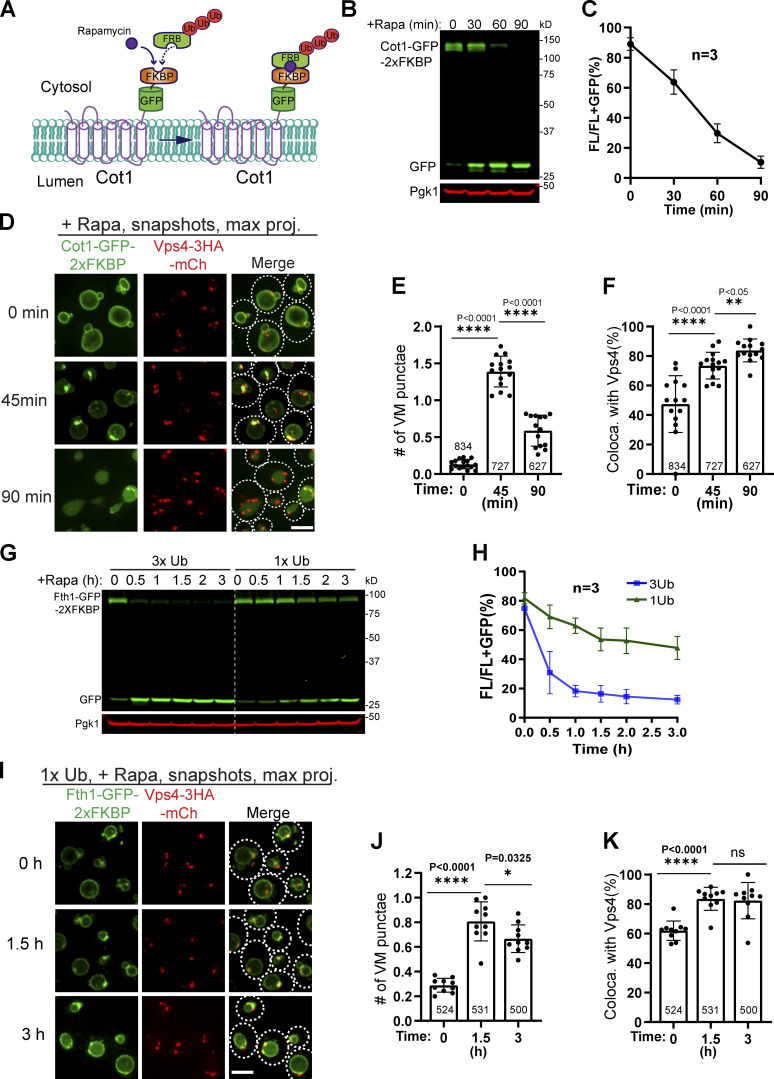
The ESCRT machinery colocalizes with ubiquitinated cargo proteins, related to Fig. 5.(A) Design of the 3xUb RapIDeg system for Cot1 degradation. (B) Western blots showing the fast degradation of Cot1-GFP-2xFKBP. (C) Quantification (±SD, n = 3) of protein levels in B. (D) Snapshots showing the colocalization of Cot1-GFP with Vps4-mCherry during degradation. (E and F) Quantification of the number of Cot1 punctae per cell and their colocalization with Vps4-mCherry in D. Each data point represents a single image containing ∼30–50 cells. A total of 13–15 images from three biological replicates were quantified at each time point. (G) Comparison of Fth1-GFP-2xFKBP degradation kinetics between 3xUb and 1xUb strains. (H) Quantification (±SD, n = 3) of protein levels in G. (I) Colocalization of Fth1-GFP-2xFKBP with Vps4-3HA-mCherry in the 1xUb RapIDeg strain. White dashed lines indicate the periphery of yeast cells. (J and K) Quantification of the number of Fth1 punctae per cell and their colocalization with Vps4-3HA-mCherry in I. Each data point represents a single image containing ∼50 cells. A total of 10 images from three biological replicates were quantified for each time point. Error bars represent SD. Numbers on each column indicated the total number of cells counted. The statistical analysis was performed with a paired Student t test. Scale bars, 3 µm.

