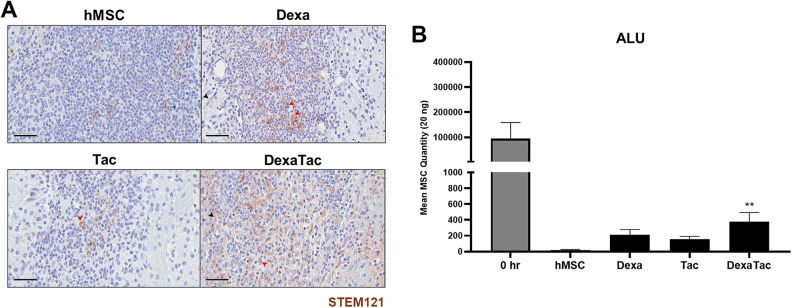
Figure 3.
Residual hMSCs remaining in the mouse parenchyma following immunosuppressant administration at Day 7. (A) IHC results of representative tissue sections from the hMSC (n = 7), Dexa (n = 6), Tac (n = 5), and DexaTac (n = 7) groups, respectively, show STEM121 positive cells that are discernible as brown signals surrounding the nuclei of the cells (solid red arrowhead). Non-specific brown signals, not enclosing the nuclei of cells, can also be identified in the surrounding tissue regions of the injection site (solid black arrowhead). (B) The number of residual hMSCs present in the parenchyma of the 0 hr (n = 3), hMSC (n = 6), Dexa (n = 7), Tac (n = 6), and DexaTac (n = 7) groups, respectively, is quantitated via ALU qPCR. 0 hr is the positive control group where unlike the other experimental groups, this group was sacrificed not at Day 7 but immediately following transplantation of hMSCs. Out of the immunosuppressant groups, the highest number of persisting hMSCs is observed from the DexaTac group. Statistical significance is defined as ** P < 0.01 vs. hMSC; mean ± SEM (One-way ANOVA). Scale bar = 50 µm.

