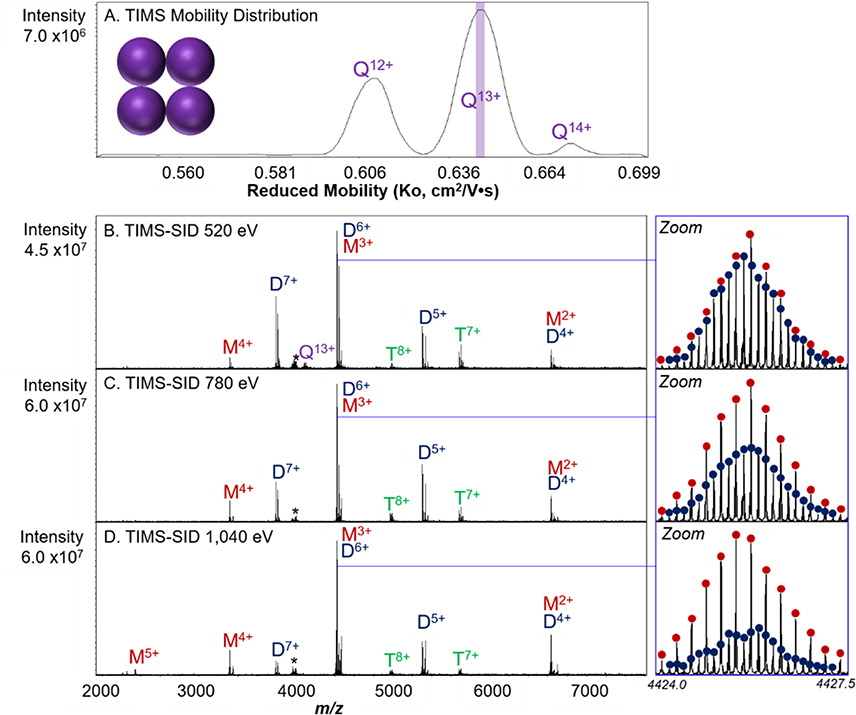
Figure 3.
TIMS mobility distribution of streptavidin tetramer with the mobility selection used for SID experiments highlighted by the purple slice (A). Reduced mobilities were calculated using the protein/protein complex calibration. TIMS-SID of mobility-selected 13+ streptavidin tetramer at different activation energies. At low SID energy (520 eV (B)), SID yields dimer and monomer products. As SID energy is increased to 780 eV (C) and 1,040 eV (D), trimers are also observed in the mass spectra. Even relatively low mass resolution (Rcalculated = 138,000) for the 15 T FT-ICR allows for identification of overlapping monomer and dimer based on isotopic distributions, as shown in the zoom-in panels. The ratio of total dimers to [monomer plus trimer] for each energy varies from 85:15 at 540 eV to 16:84 at 1040 eV. The asterisk denotes a noise peak.

