
Figure 6.
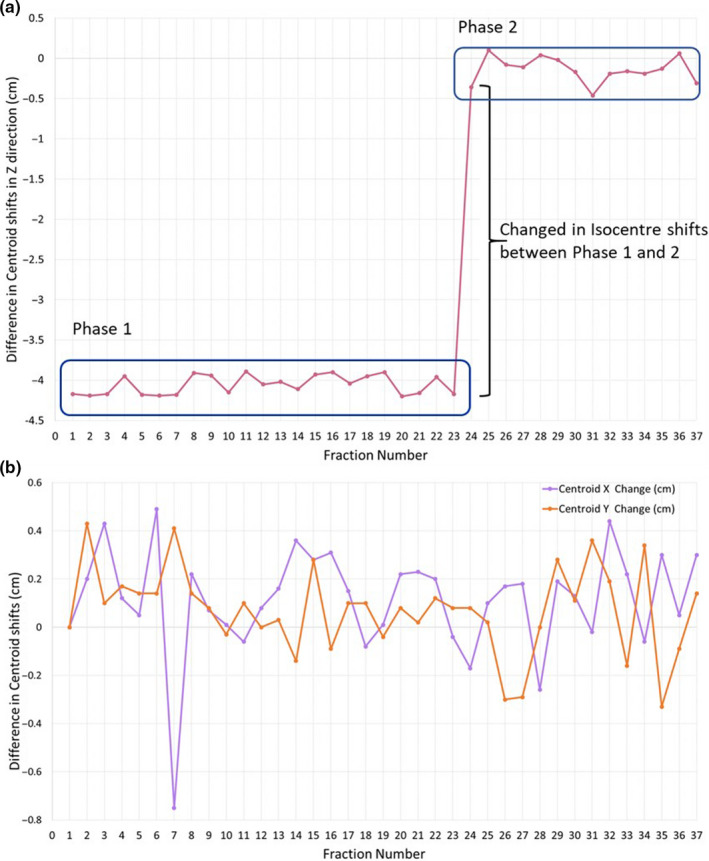
Prostate motion trend analysis shown as the variation in prostate centroid location relative to the CBCT1 baseline. (A) Variation in superior–inferior position; significant change was observed between the 23rd and 24th fraction due to the change in isocentre position. (B) Variation in left–right (purple) and anterior–posterior (orange) position.