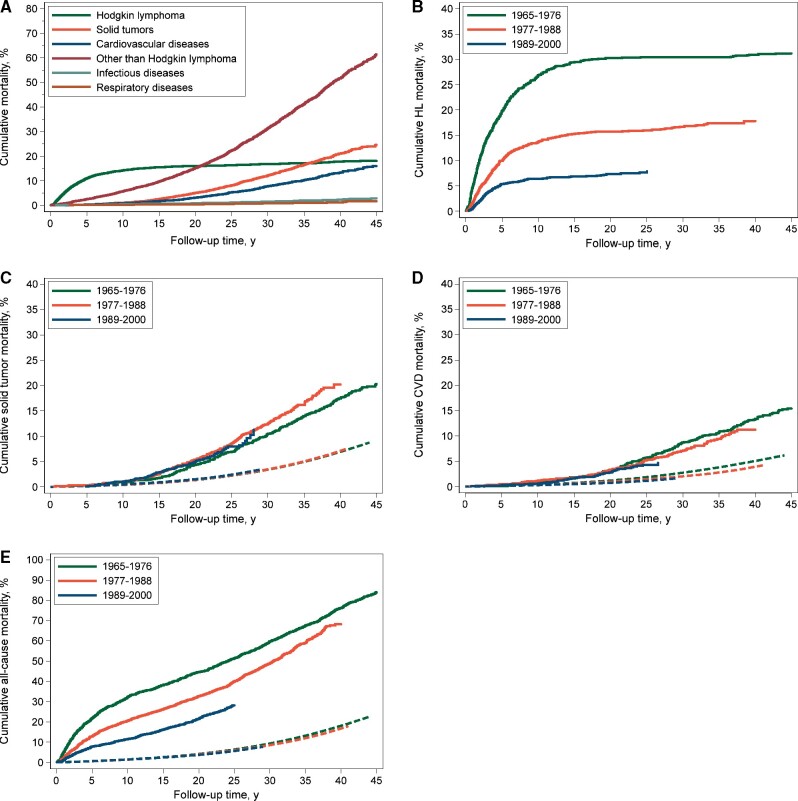
Figure 2.
Cumulative mortality from major disease categories in the entire cohort (A) and cumulative mortality by treatment period from Hodgkin lymphoma (HL) (B), solid tumors (C), cardiovascular disease (CVD) (D), and all causes (E). Solid lines represent the observed cumulative mortality, and dashed lines represent the expected mortality based on general population rates.

