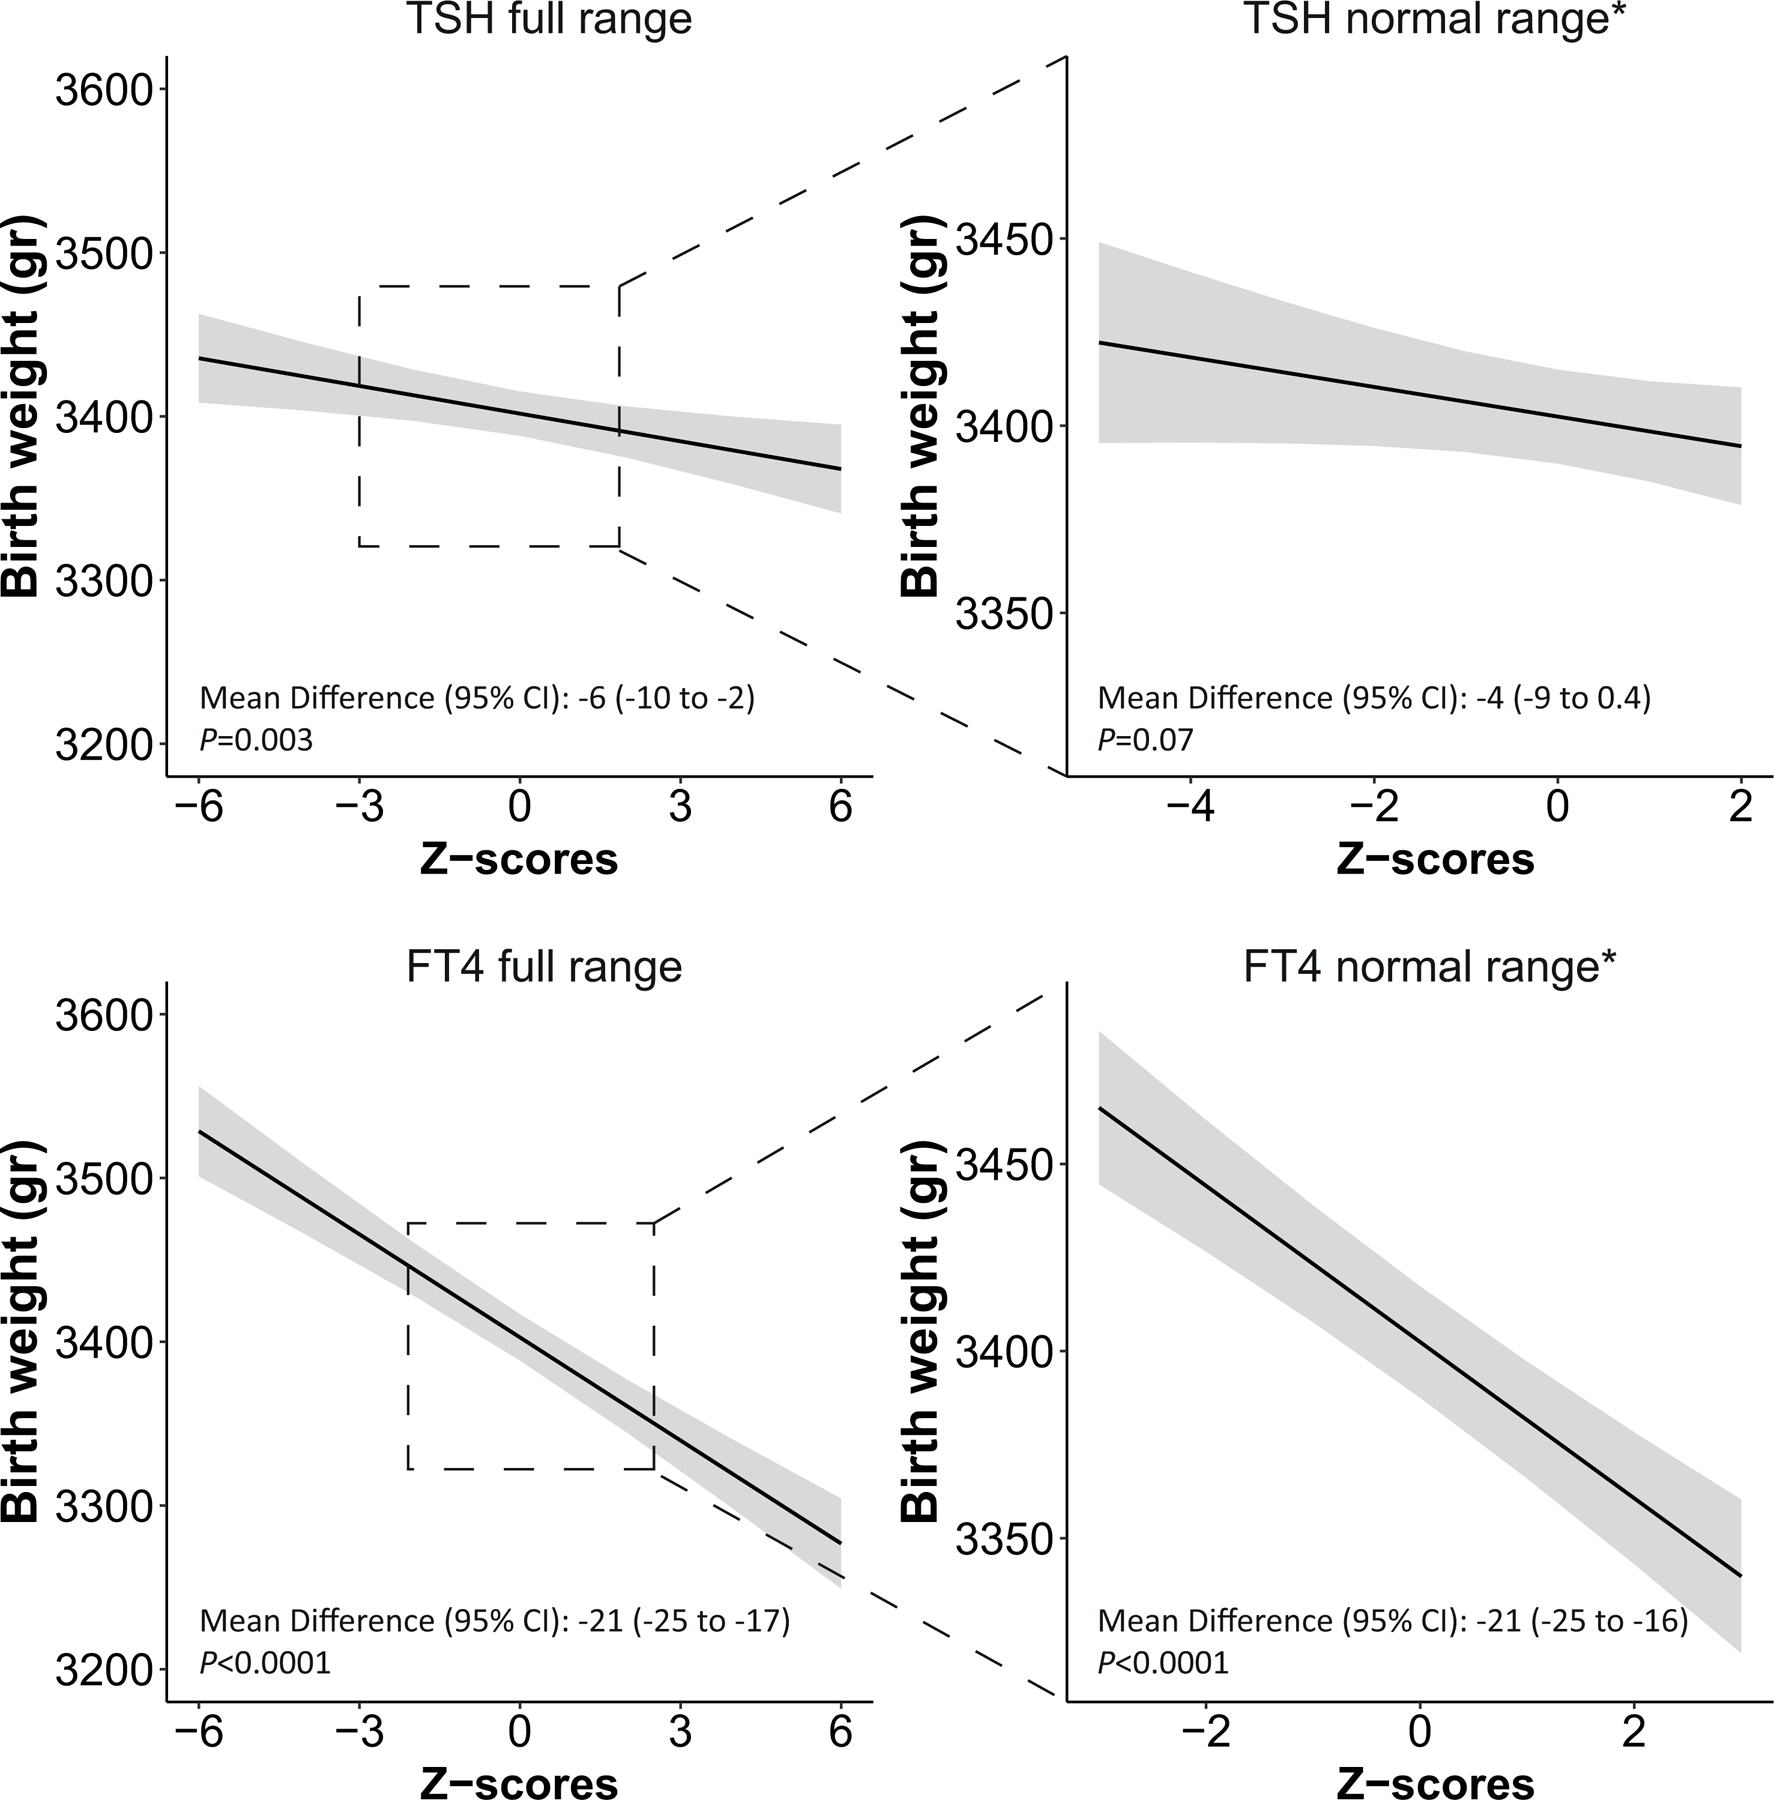
Figure 3.


Association of TSH and FT4 concentrations with small or large for gestational age and birth weight.
Figures show the association of maternal TSH and FT4 in full range or within the normal range (2.5th–97.5th percentiles) with small or large for gestational age (panel A) and birth weight in grams (panel B). All analyses were adjusted for maternal age, BMI, ethnicity, smoking, parity, gestational age at blood sampling, fetal sex and gestational age at birth (the latter two for birth weight only).
* After exclusion of outliers of TSH (n=453) or FT4 (n=169).
† Normal range (2.5th–97.5th percentiles) is defined based on cohort-specific absolute measurements of TSH or FT4, which in the standardized data corresponds to TSH Z-score range of −4.2 to 1.8 and FT4 Z-score range of −2.2 to 2.5.
