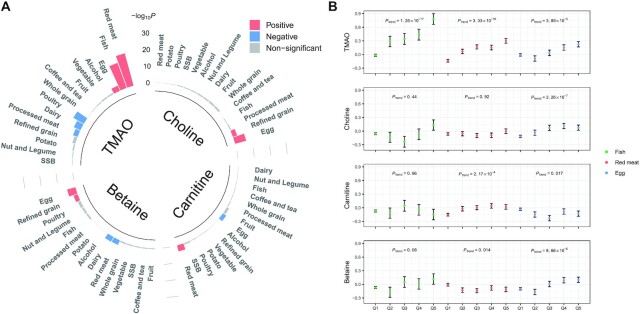
FIGURE 1.
Associations of food groups with serum TMAO and its precursor metabolites. (A) Associations (−log10P) of 15 food groups with serum TMAO and its precursor metabolites in 3466 individuals. P values were estimated from linear regression after adjustment for age, sex, BMI, study field center, Hispanic/Latino background, education, yearly household income, smoking, alcohol consumption, total energy intake, physical activity, diabetes, hypertension, and dyslipidemia. Red bars indicate positive associations (FDR-adjusted P < 0.05), blue bars indicate inverse associations (FDR-adjusted P < 0.05), and gray bars indicate nonsignificance (FDR-adjusted P ≥ 0.05). (B) Circulating concentrations of TMAO and its precursor metabolites (inverse normal transformation) across quintiles of fish, red meat, and egg intakes in 3466 individuals. The dots and error bars are the means and SEs estimated from linear regression models, which included all 15 food groups in the same model after multivariable adjustment for age, sex, BMI, study field center, Hispanic/Latino background, education, yearly household income, smoking, alcohol consumption, total energy intake, physical activity, diabetes, hypertension, and dyslipidemia. Numbers of individuals were 3191, 71, 64, 67, and 73 across the quintiles of fish intake; 1708, 434, 474, 401, and 449 across the quintiles of red meat intake; and 2339, 288, 270, 282, and 287 across the quintiles of egg intake. FDR, false discovery rate; SSB, sugar-sweetened beverage; TMAO, trimethylamine-N-oxide.

