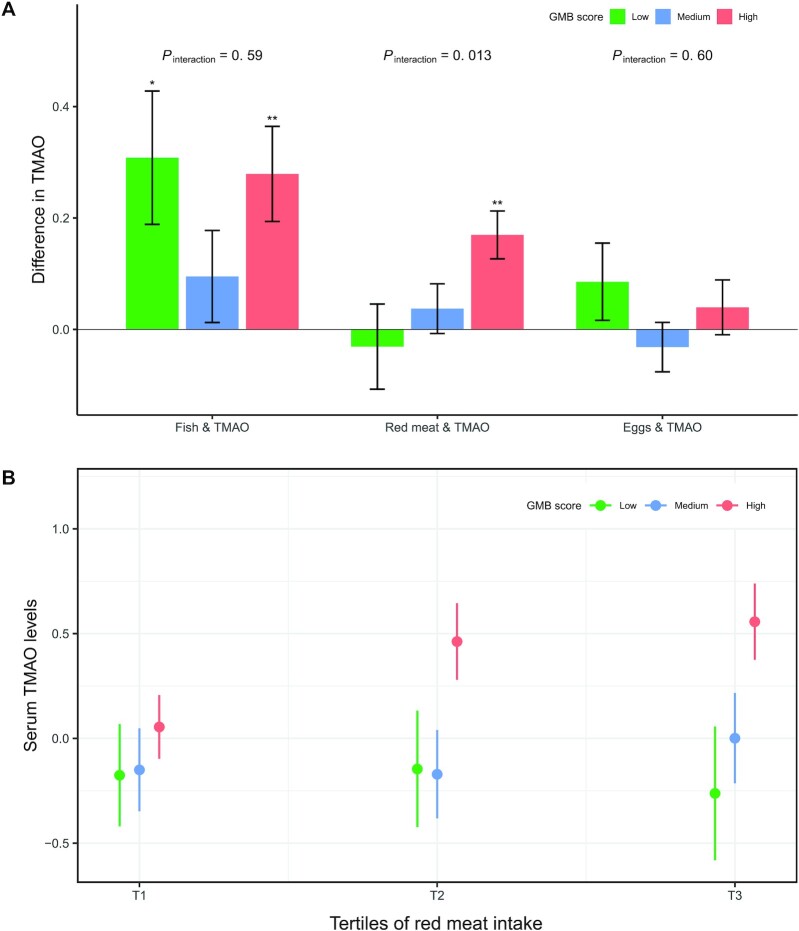
FIGURE 3.
Associations of fish, red meat, and egg intake with TMAO according to the GMB score. (A) Data are effect size (β coefficients and SEs) of food intake (per quintile) on serum TMAO levels (inverse-normal transformed) estimated from linear regression after adjustment for age, sex, BMI, study field center, Hispanic/Latino background, physical activity, alcohol consumption, smoking, education, yearly household income, total energy intake, diabetes, hypertension, dyslipidemia, and use of antibiotics and probiotics. The GMB score (range 0–4) was calculated based on the abundance of the 4 microbial species positively associated with TMAO (less than median value = 0; equal to or greater than median value = 1): 0, low GMB score ( n = 137); 1–2, medium GMB score (n = 241); and 3–4, high GMB score (n = 248). * , ** Significant difference in TMAO concentration were estimated from multivariable linear regression models: *P < 0.05 and **P < 0.01 . P-interaction values were calculated by adding a multiplicative factor in the multivariable linear regression models. (B) TMAO levels (inverse-normal transformed) across tertiles (instead of quintiles to ensure adequate sample sizes) of red meat intake according to GMB score. Data are means and SEs estimated from linear regression after adjustment for age, sex, BMI, study field center, Hispanic/Latino background, physical activity, alcohol consumption, smoking, education, yearly household income, total energy intake, diabetes, hypertension, and dyslipidemia. P-trend values across tertiles of red meat intake were 0.83, 0.40, and 6.21 × 10⁻⁴ in the low, medium, and high GMB score groups, respectively. Numbers of individuals were 70, 119, and 126 across the low, medium, and high GMB score groups in the first tertile of red meat intake; 38, 64, and 52 across the 3 GMB score groups in the second tertile of red meat intake; and 28, 55, and 69 across the 3 GMB score groups in the third tertile of red meat intake, respectively. GMB, gut microbiota; TMAO, trimethylamine-N-oxide.

