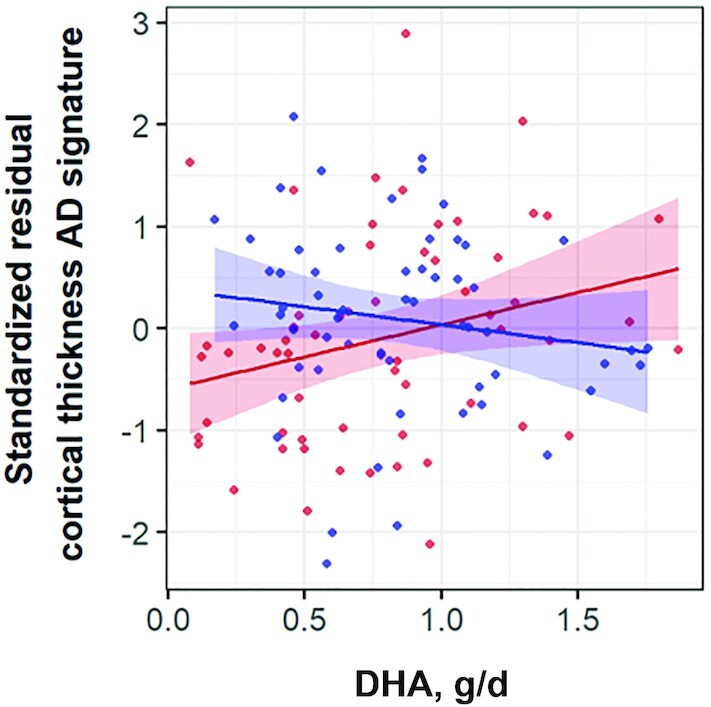
FIGURE 1.

Scatterplot of the association between self-reported dietary intake of DHA and standardized residuals of cortical thickness in the AD signature by Jack et al. (23), outputted from a general linear model including gender, age, BMI, hypercholesterolemia, hypertension, energy intake, and α-linolenic acid intake, in APOE-ε4 homozygotes (n = 59, in red) and nonhomozygotes matched for selected adjusting covariates (n = 59, in blue). P value for the DHA × APOE-ε4 interaction = 0.025. Pearson correlation coefficient = −0.151 (P = 0.253) for APOE-ε4 homozygotes; Pearson correlation coefficient = 0.267 (P = 0.041) for matched nonhomozygotes. AD, Alzheimer disease.
