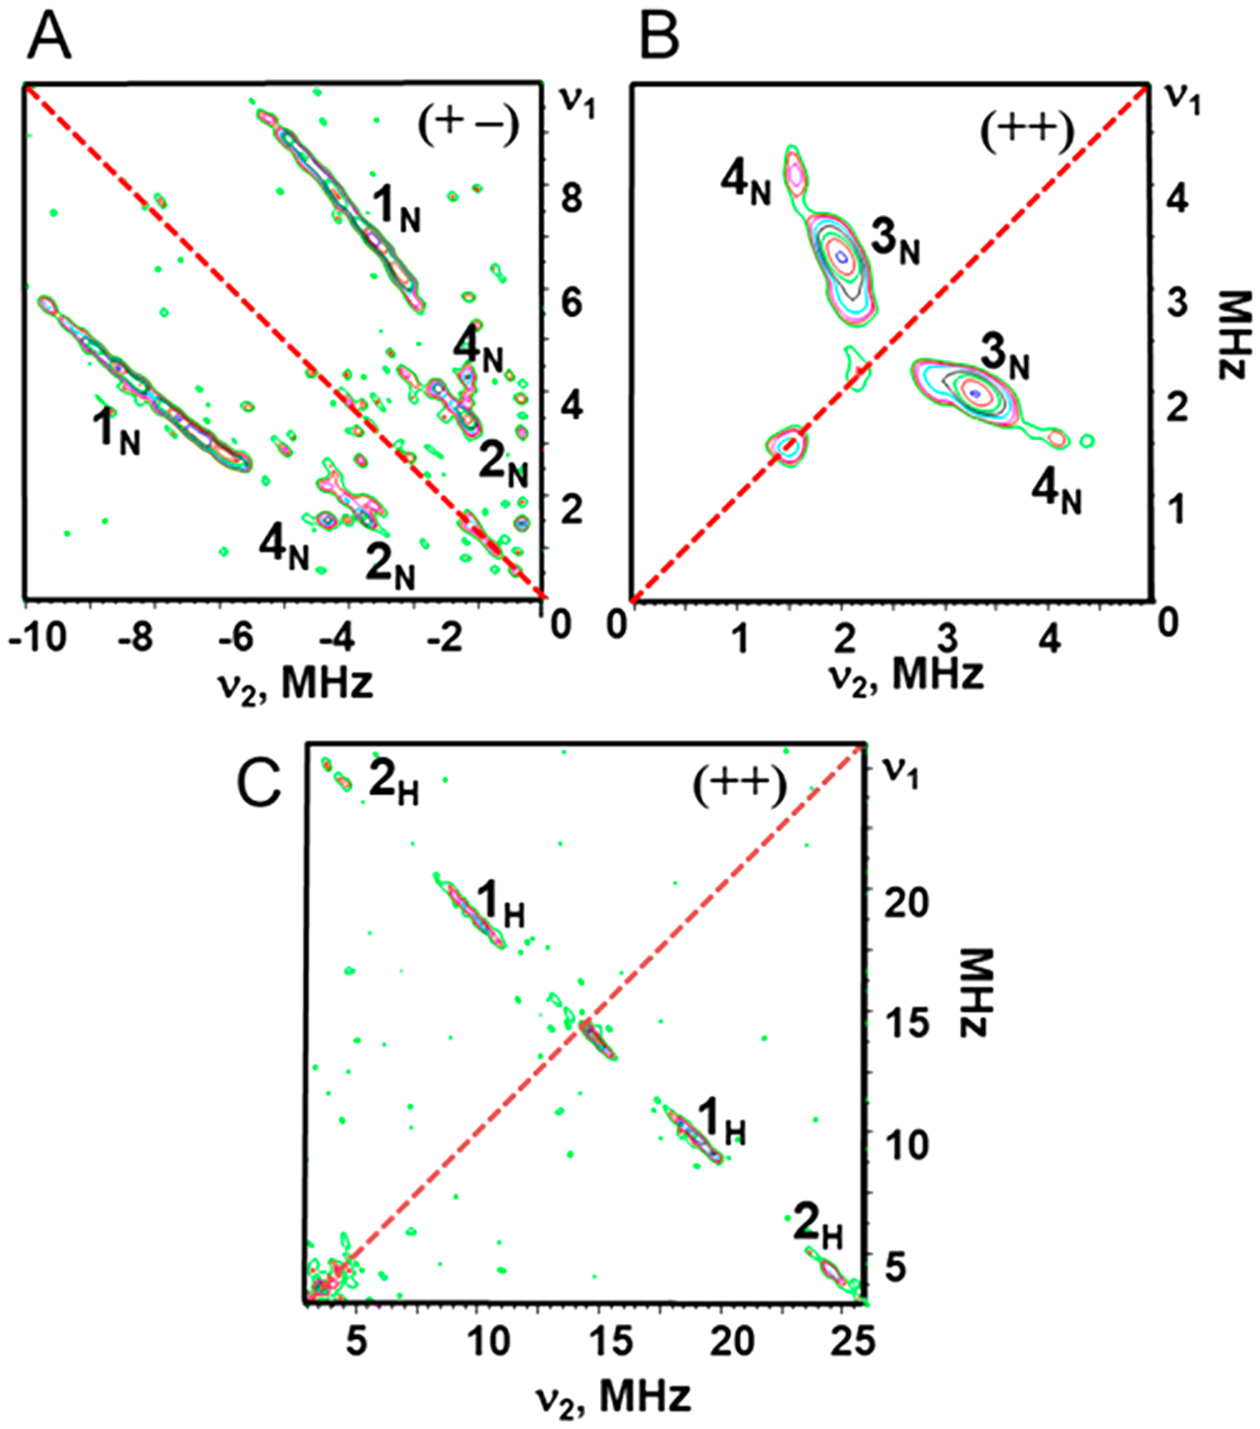
Figure 6.

Contour representations of the 14N and 1H HYSCORE spectra of Cu-reconstituted CuACcP. (A) Features of strongly coupled 14N nuclei appear in the (+−) quadrant; (B) weakly coupled features in the (++) quadrant. (C) 1H HYSCORE spectrum of the CuA-like species. Hyperfine splitting values for the cross-ridges were determined in first order as the absolute difference A = |ν1-ν2|, where ν1 and ν2 are coordinates of the point with the maximum intensity for cross-ridges 1H and 2H. Spectra were collected with a microwave frequency of 9.6316 GHz, magnetic field of 336 mT, and time between the first and second pulses (τ) of 136 ns.
