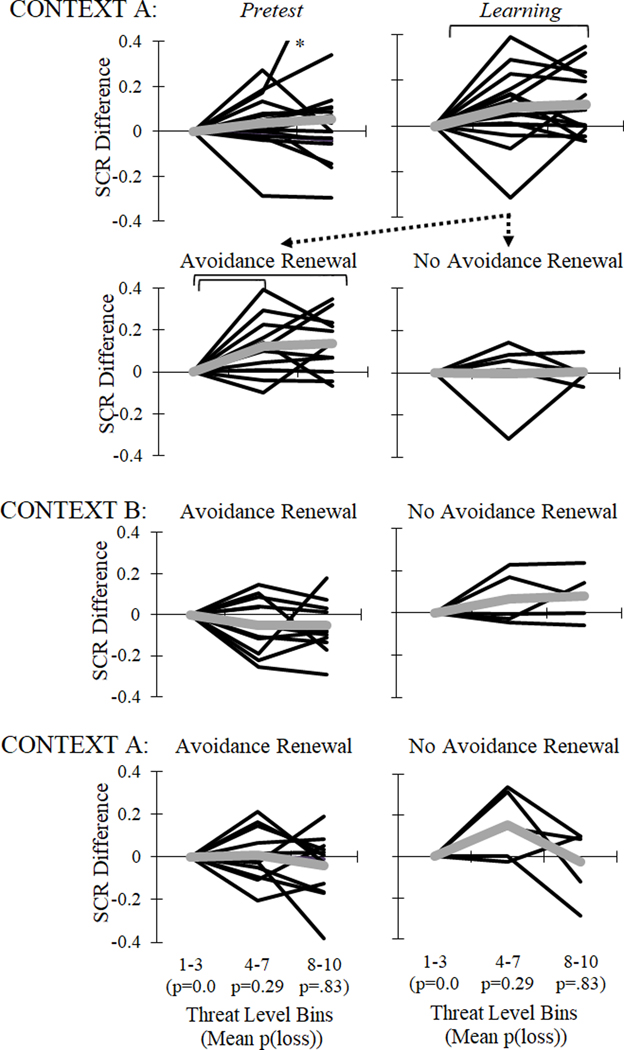
Figure 8. Effects of escalating threat on SCR changes.
Each function plotted represents a participant and group means are highlighted by a thick grey line. Binned threat levels (1–3, 4–7, 8–10) and associated mean loss probabilities appear on the x-axis. (See Methods for how individual SCR differences were calculated). [Context A] Threat Learning: No significant changes in group SCR were found at pretest. During Threat Learning, there were significant changes in group SCR, highlighting successful differential conditioning. Subdividing participants into groups that showed Avoidance Renewal (N=12) or No Avoidance Renewal (N=5) during subsequent renewal testing revealed significant SCR changes only in the Avoidance Renewal group. [Context B] Threat Extinction: Both group SCR showed no significant changes. [Context A] Renewal Testing during the AP-AV task: Both group SCR showed no significant changes. (Bars = significant post-hoc differences. *Outlier: SCR response of .80 in bin 8–10.)

