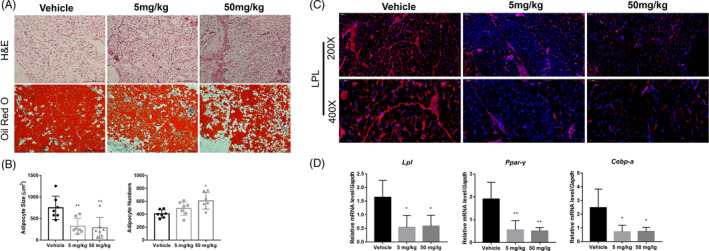
FIGURE 8.

APR inhibited adipogenesis in inguinal fat pad of male mice. A, Representative H&E and Oil Red O staining pictures of inguinal adipocytes at 1 week after surgery. B, Quantitative analysis of adipocyte size and number in inguinal fat after 1‐week APR treatment, n = 7. C, Representative LPL‐immunofluorescence pictures of inguinal adipocytes at 1‐week post‐treatment. D, qPCR results of Lpl, Ppar‐γ, Cebp‐α in inguinal fat after 1‐week APR treatment, n = 7. Data shown as mean ± SD. *P < .05 vs Vehicle; **P < .01 vs Vehicle
