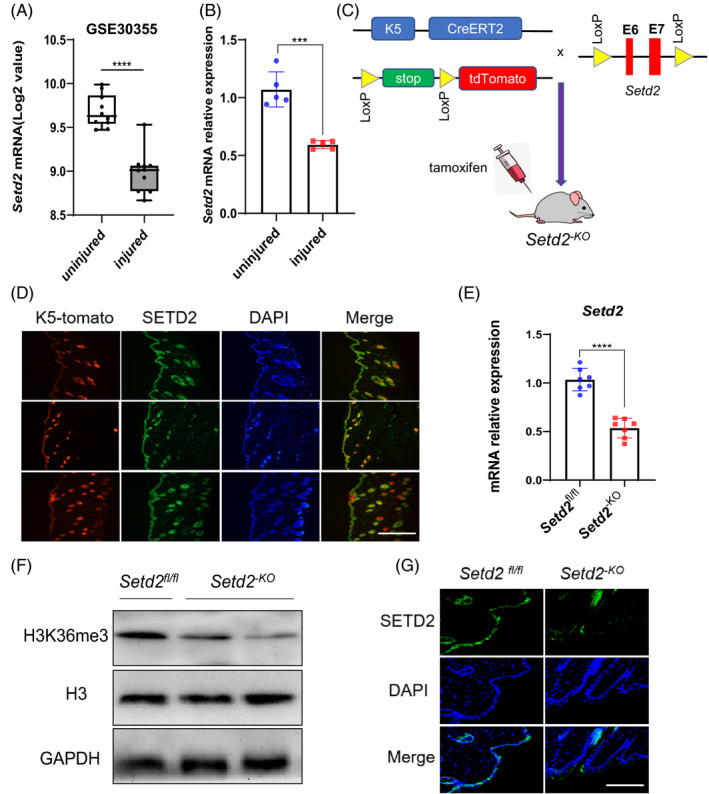
FIGURE 1.

The expression of Setd2 in KCs and the generation of epidermis‐specific Setd2‐deficient mice. A, Box plot of Setd2 expression levels in normal and injured KCs (using dataset GSE30355; n = 10). B, RT‐qPCR analysis of the Setd2 mRNA expression in injured and uninjured skin tissues of wild‐type mice (n = 5). C, Schematic representation of generating the Setd2‐KO mouse model. D, Colocalization of SETD2 (green) and CK5‐Tomato (red) was visualized on frozen skin sections from CK5CreERT2; Tomato adult mice induced by tamoxifen. The nuclei were stained with DAPI (blue). Scale bars: 200 μm. E, RT‐qPCR analysis of Setd2 mRNA in control and Setd2‐KO mice (n = 7). F, Western blot analysis of H3K36me3 protein levels. Representative blots are shown. G, Representative immunofluorescence images showing protein expression of SETD2 in Setd2‐KO and Setd2fl/fl mice. Scale bars: 200 μm. Data are presented as the mean ± SD; statistical significance was determined using a two‐tailed Student's t test, ****P < .0001
