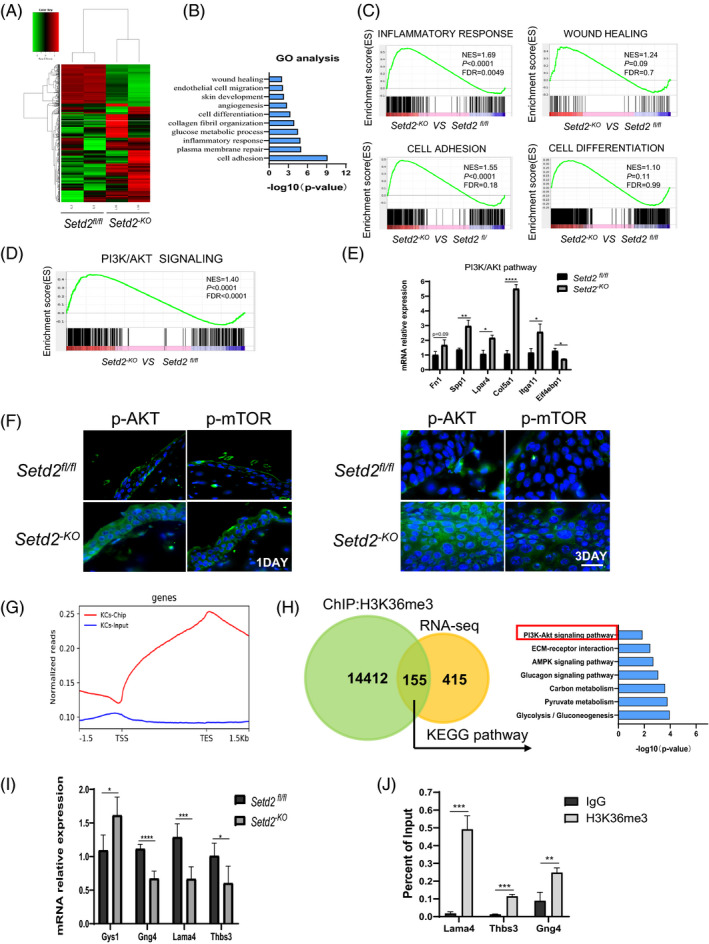
FIGURE 5.

Setd2‐deficient skin displays hyperactive AKT/mTOR Signalling A, Heat map of differentially expressed genes in age‐matched Setd2fl/fl and Setd2‐KO mice. B, GO term analysis demonstrating upregulated biological processes in age‐matched Setd2fl/fl and Setd2‐KO mice. C, GSEA enrichment plots of differentially expressed genes associated with SETD2 deletion. D, GSEA enrichment plots of differentially expressed genes that belong to PI3K/AKT signalling pathway and associated with SETD2 deletion. E, RT‐qPCR analysis of genes related to PI3K/AKT/mTOR signalling. F, Immunofluorescent staining of Setd2fl/fl and Setd2‐KO wound sections using anti‐p‐AKT and anti‐p‐mTOR (green) antibodies on days 1 and 3 post‐wounding. Representative images are showing the wound epithelium areas. Nuclei are stained with DAPI (blue). Scale bars: 50 μm. G, Normalized read density of H3K36me3 ChIP‐seq and input signals of primary KCs from Setd2fl/fl mice, from 1.5 kb upstream of the TSS to 1.5 kb downstream of the TES. H, Venn diagram illustrating H3K36me3 peaks in Setd2fl/fl primary KCs and the overlap with total differential expression genes determined by RNA sequencing. Right panel shows the KEGG analysis of the overlapping genes. I, RT‐qPCR analysis of PI3K/AKT related gene expression in Setd2fl/fl and Setd2‐KO mice as indicated. J, ChIP‐qPCR analysis of H3K36me3 binding for Gng4, Lama4 and Thbs3 loci in primary KCs from Setd2fl/fl mice; IgG was used as the control. Data are presented as the mean ± SD; statistical significance was determined using a two‐tailed Student's t test; *P < .05, **P < .01, ***P < .001 and ****P < .0001
