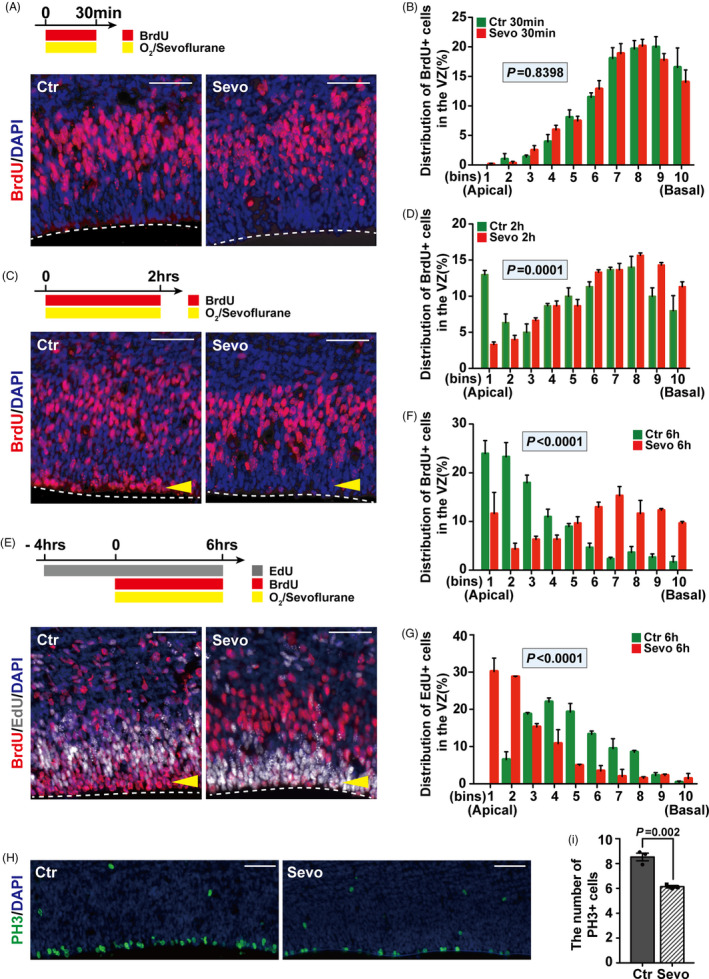
FIGURE 1.

Maternal sevoflurane exposure impairs the INM of RGPs. (A, C, E) Representative images of sections from embryonic brains that were exposed to sevoflurane for 30 min (A), 2hrs (C) and 6hrs (E) stained for BrdU or EdU in both Ctr and Sevo groups. The VZ surface is outlined by a dashed line. (B, D, F, G) Quantification of the distribution of BrdU+ cells or EdU+ cells in each bin (the VZ was divided equally into 10 bins) after treatment for 30 min (B), 2hrs (D), 6hrs (F, G). Bin 1 starts from the apical surface. n = 3 for each group. (H) Representative images for PH3 in cortices of the Ctr and the Sevo groups. (I) Quantification shows the decreased number of PH3 + cells after sevoflurane exposure. n = 3 for each group. Data are presented as mean ± SEM. Scale bars represent 50 μm
