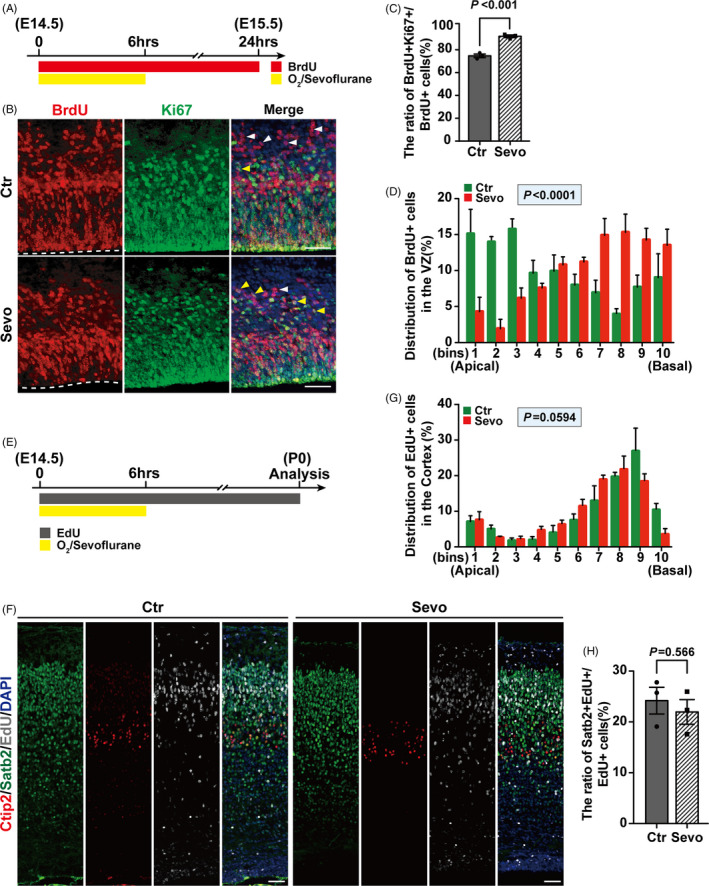
FIGURE 2.

Maternal sevoflurane exposure disturbs cell cycle progression. (A, B) Representative images of sections from embryonic brains 24hrs after treatment on E14.5 (A) stained for BrdU and Ki67 (B). The VZ surface is outlined by a dashed line. (C) Quantifications show the ratio of BrdU+Ki67+ cells/BrdU+ cells was increased in the Sevo group compare to the Ctr group. The yellow arrows indicate the cells co‐labelled with BrdU and Ki67, while the white arrow only labelled with BrdU. n = 3 for each group. (D) Quantification of the distribution of BrdU+ cells in each bin (the VZ was divided as Figure 1). n = 3 for each group. (E) Schematic diagram of the timing of sevoflurane exposure at E14.5 and analysis at P0. (F) Representative images of embryonic cortices at P0 stained with EdU, Ctip2 and Satb2. (G) Quantification of the distribution of EdU+ cells in each bin (the cortex was divided equally into 10 bins) after prenatal treatment at P0. Bin 1 starts from the apical surface. n = 3 for each group. (H) Quantifications for the ratio of Satb2+EdU+ cells/EdU+ cells after prenatal treatment between the two groups at P0. n = 3 for each group. Data are presented as mean ± SEM. Scale bars represent 50 μm
