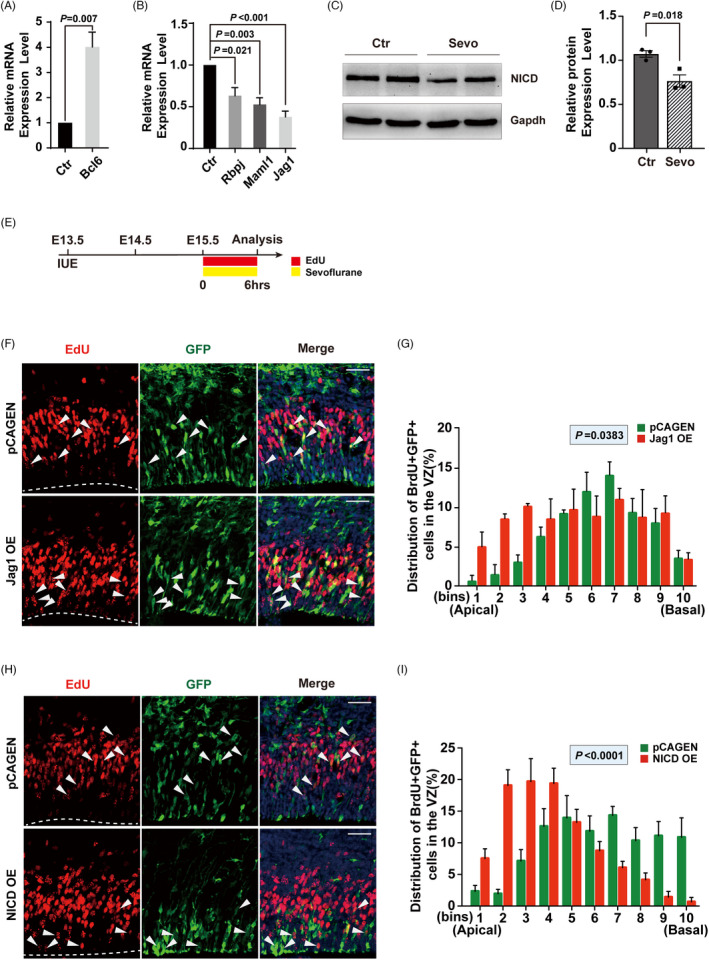
FIGURE 5.

Notch signalling pathway is involved in INM defects induced by sevoflurane. (A, B) qPCR analysis to validate Notch‐related upregulated DEG. (A) and downregulated DEGs (B). n = 3 for each group. (C, D) The relative protein expression of NICD. n = 3 for each group. (E) Schematic diagram of the timing for IUE and sevoflurane exposure. (F, H) Representative images of sevoflurane exposed embryonic sections on E15.5 stained with GFP and EdU after IUE with NICD overexpression plasmid (F) or Jag1 overexpression plasmid (H) on E13.5. The VZ surface is outlined by a dashed line. The white arrows indicate EdU+ cells are co‐labelled with GFP. (G, I) Quantification of the distribution of EdU+ cells in each bin for (F, H) (the VZ was divided as Figure 1). n = 3 for each group. Data are presented as mean ± SEM. Scale bars represent 50 μm
