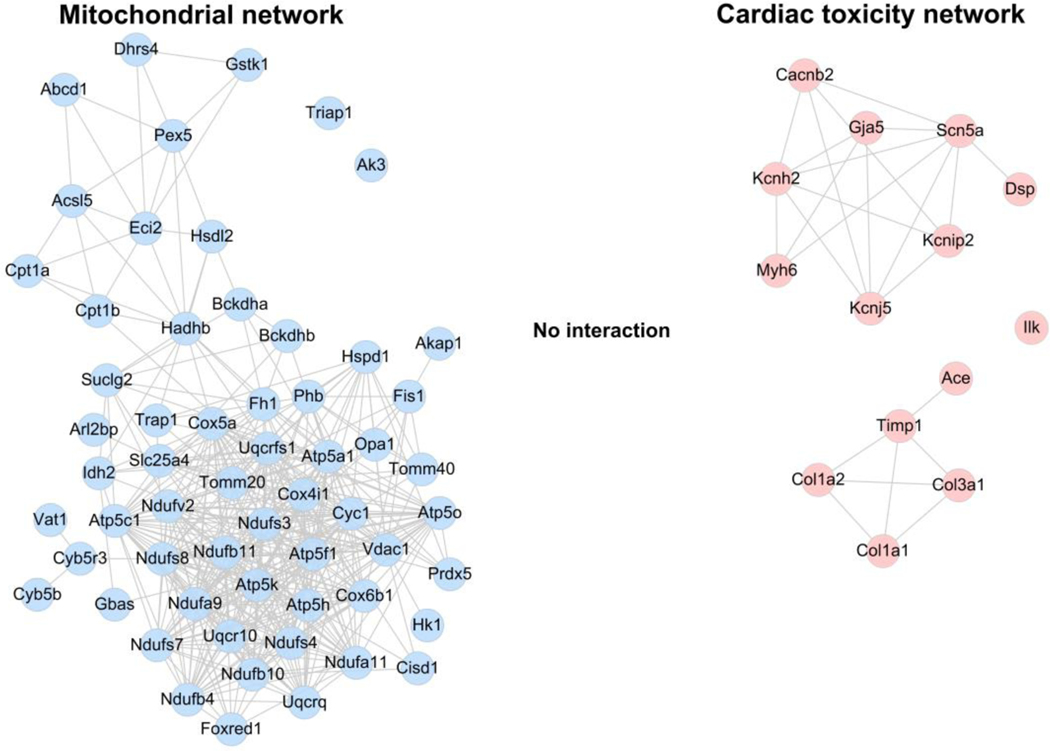
Fig. 6. The PPI networks for mitochondria-related genes and arrhythmia-related genes.
Left panel represents the mitochondria-PPI network constructed for the representative 59 differentially expressed genes/proteins in the mitochondria (blue node). The right panel includes the PPI network for 14 cardiac toxicity genes (red node). The edges connecting the nodes represented PPIs. There is no edge connecting the blue and red nodes, indicating no interaction between these mitochondria-related and cardiac toxicity-related PPI networks.

