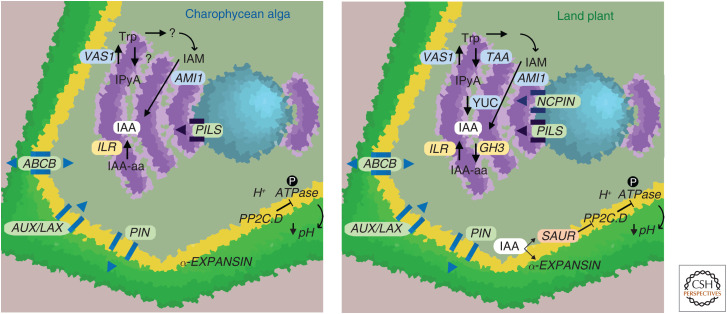
Figure 2.
Control of auxin homeostasis in charophycean algae and land plants. Biosynthesis and metabolism: In land plants, tryptophan (trp) is the substrate for TRYPTOPHAN AMINOTRANSFERASE (TAA), which produces indole-3-pyruvic acid (IPyA) that is subsequently converted to indole-3-acetic acid (IAA) by YUCCA enzymatic activity. The conversion of trp to IPyA could be mediated by a TAA/TAR34 ortholog in charophycean algae but this needs experimental corroboration. VAS1 enzymes mediating the conversion of IPyA into Trp are conserved across Streptophytes. In land plants, GH3 enzymes conjugate free IAA into amino acid conjugates (IAA-aa) and ILRs conversely hydrolyze IAA-aa back into free IAA. Whereas GH3 genes have not been found in charophytes, ILR enzymes are conserved across Streptophytes, suggesting hydrolysis of IAA-amino acid conjugates into auxin may occur in charophycean algae. Amidases that convert IAM into IAA are conserved across Streptophytes, suggestive of a possible older auxin metabolic pathway. Transport: Auxin transporters of the PIN, PILS, ABCB, and AUX/LAX protein families were present in the common ancestor of Streptophytes, implying intracellular (PILS) and intercellular (AUX/LAX, ABCB, PIN) active transport was present in the charophycean algae ancestor. In land plants, NCPINs channel auxin into the endoplasmic reticulum (ER), a role perhaps filled by PILS proteins in algae. Cell expansion: Acid growth modulated by H+ ATPases, PP2C-D phosphatases and EXPANSINs is present in charophycean algal lineages (e.g., Nitella). Given the absence of SAUR genes in charophycean algae, acid growth may not have been dependent on auxin levels in the Streptophyte ancestor. In land plants, acid growth is dependent on auxin, as IAA induces both SAUR and α-EXPANSIN transcription. SAURs inhibit PP2C-D phosphatases, allowing phosphorylation of H+ ATPases and acidification of the apoplastic environment. Acid growth in turn is dependent on the cell wall loosening activity of α-EXPANSINs. In cell diagrams, the cell wall (green), cell membrane (yellow), ER (purple), and nucleus (blue) are color coded.

