FIGURE 4.
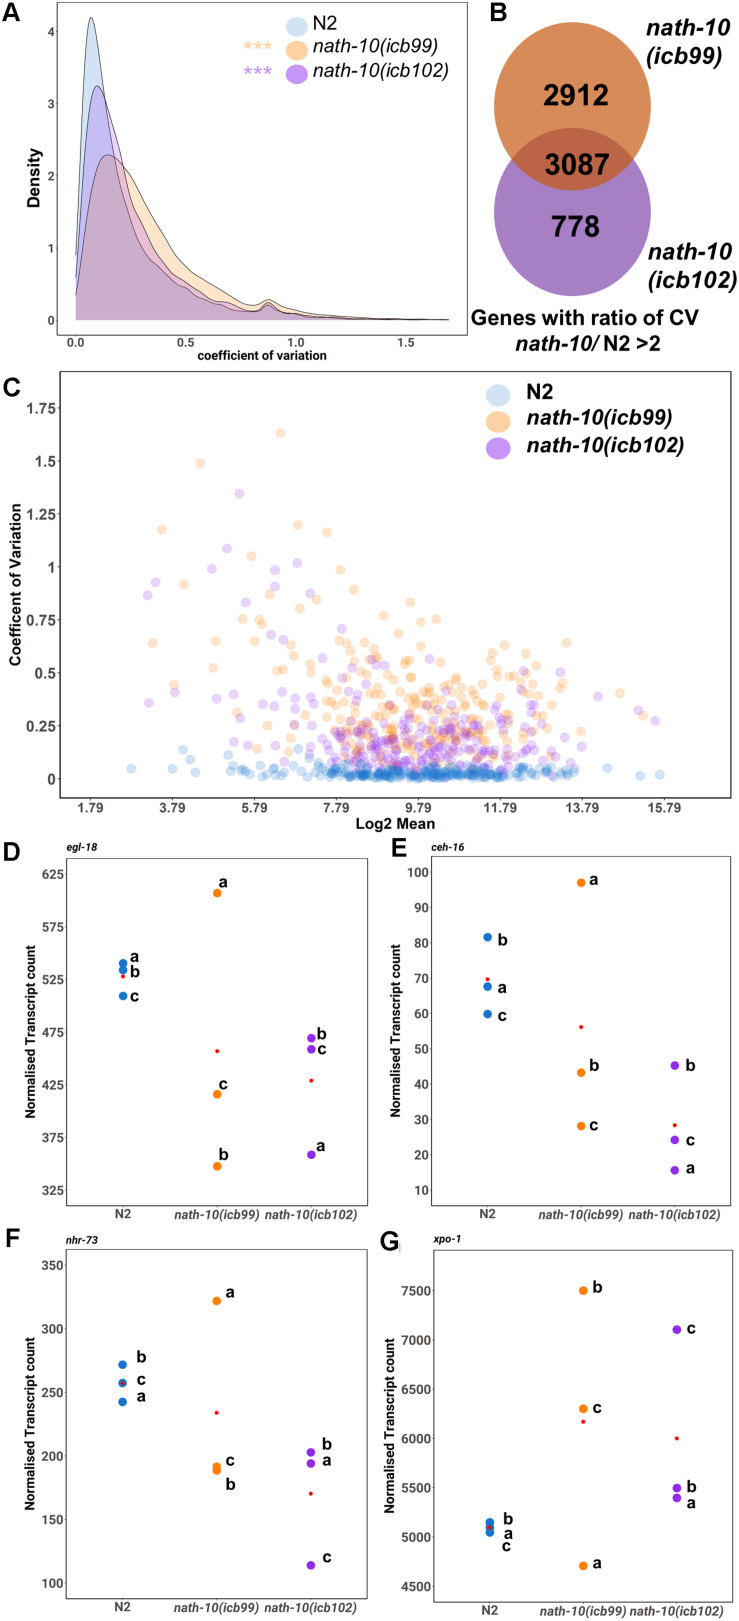
RNA-seq analysis reveals changes in transcript variance at the population level. (A) Density plots of coefficient of variation (CV) in nath-10 mutants and N2. Both nath-10 alleles show significant change in the distribution of the coefficient of variation compared to N2, with a trend toward an increase in transcript variability (Kolmogorov-Smirnov test, ***p < 0.001). (B) Venn diagram displaying the overlap of genes that display a > 2 ratio of CV when compared to N2 for nath-10(icb99) and nath-10(icb102) mutants. Both alleles show a 50% overlap of the most variable genes and this overlap includes core seam cell transcription factors ceh-16, egl-18, and nhr-73. (C) Coefficient of variation plotted against the log2 normalized transcript counts from RNA-seq analysis for seam cell-enriched genes in nath-10 alleles and wild type. (D–G) Normalized transcript counts plotted per replicate (a, b, c) for N2, nath-10(icb99) and nath-10(icb102) showing egl-18, ceh-16, nhr-73 and xpo-1 expression. Note that both nath-10 alleles display a great spread of normalized transcript count compared to the N2 replicates and the variance is not driven consistently by the same replicate for each gene.

